Includes historical data for Sierra Leone’s Gross Domestic Product growth, debt-to-GDP ratio and more, as well as information on trade, banking and financial sector leadership.
Mineral Wealth And Agricultural Potential
Located on the coast of West Africa and bordering Guinea to the north and Liberia to the South, Sierra Leone emerged from a decade-long brutal civil war in 2002. Post-civil war, with help from international institutions and donors, it began rebuilding, rapidly achieving some of the world’s highest economic growth rates. When Ebola struck in 2014 and 2015, it plunged the country into yet another difficult crisis.
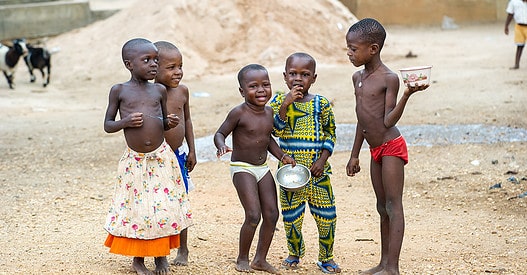
Sierra Leone boasts rich mineral reserves, fishery resources, plenty of arable land, and tourism potential. Significant opportunities for domestic and foreign investors also exist in energy, water, telecommunications and infrastructure. However, they face significant challenges, including corruption, a weak rule of law, deficient business regulations, and an underdeveloped financial sector. Furthermore, widespread poverty, youth unemployment and a lack of skilled labor, as well as vulnerability to weather conditions and dependency on commodity prices, compound the country’s problems.
Macroeconomy & Sovereign Data
| Type of Government | Presidential republic |
|---|---|
| Capital | Freetown |
| Sovereign Ratings |
S&P: Not rated Moody’s: Not rated Fitch: Not rated |
| Total Population | 8.6 million |
| Median Age | 19.5 |
| Adult Per Capita Income (PPP) | 3,760.01 |
| Total GDP (2023) | 4.6 billion |
Sierra Leone GDP & Economic Overview
Most Recent Content
Sierra Leone
Emerging & Frontier Markets
Rich Potential: Sierra LeoneCapital Raising & Corporate Finance
ANNUAL SURVEY: WORLD’S BEST BANKS 2014Awards
BEST BANKS 2014: AFRICA
Banking & Finance
Trade & Investment
| Total Exports | USD 2.2 billion (2023) |
|---|---|
| Leading Exports |
Titanium Lumber Diamonds Aluminum Cocoa Beans |
| Total Imports | USD 1.5 billion (2022) |
| Leading Imports |
Rice Plastics Packaged Medicines Sauces/Seasonings Cars |
| Source: | World Integrated Trade Solution |
Sierra Leone Leading Companies
| Rokel Commercial Bank | Financials |
|---|---|
| Sierra Leone Commercial Bank | Financials |
| Union Trust Bank | Financials |
| Sierra Leone National Petroleum | Oil & Gas Refining & Marketing |
| National Diamond Mining Company | Materials, Metals & Mining |
| Sierra Tel | Telecommunication Services |
| Sierra Leone Brewery | Consumer Staples, Brewers |
Major Trade Partners — Import
| China | 20% |
|---|---|
| United Arab Emirates | 8% |
| Belgium | 8% |
| India | 7% |
| United States | 5% |
Source: World Integrated Trade Solution
Major Trade Partners — Export
| China | 18% |
|---|---|
| South Korea | 14% |
| Netherlands | 14% |
| Somalia | 11% |
| Ghana | 8% |
Source: World Integrated Trade Solution
Global Finance Rankings & Awards


Data Sources:
UN World Population Prospects
World Inequality Report
S&P Global Ratings
Moody’s
Fitch Ratings
IMF Direction of Trade Statistics (DOTS)
UN Conference on Trade and Development (UNCTAD)
CIA The World Factbook
World Bank’s World Integrated Trade Solution
Forbes Global 2000