Includes historical data for Singapore’s Gross Domestic Product growth, debt-to-GDP ratio and more, as well as information on trade, banking and financial sector leadership.
The World’s Wealthiest City-State
One of the world’s wealthiest nations, Singapore’s prosperity is bolstered by an open and competitive trade regime, robust financial and corporate sectors, and a business-friendly legal and tax framework. Dominated by services, Singapore is also a major manufacturer of electronics, machinery, pharmaceuticals, and chemicals and petrochemicals.
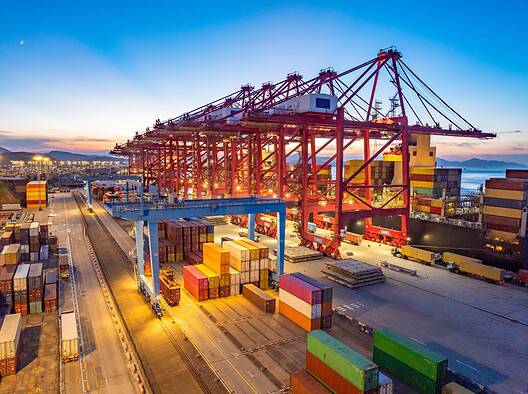
With one of the world’s largest ports and nearly all sectors of the economy fully open to foreign ownership, Singapore is a regional hub for thousands of multinational companies. Weaknesses include a high dependence on imports for energy and consumer goods in particular, a heavy reliance on foreign workers, and vulnerability to slowdowns in the Chinese economy.
Macroeconomy & Sovereign Data
| Type of Government | Parliamentary republic |
|---|---|
| Capital | Singapore |
| Sovereign Ratings |
S&P: AAA Moody’s: Aaa Fitch: AAA |
| Total Population | 6.08 million |
| Median Age | 36.2 |
| Adult Per Capita Income (USD PPP) | 180,206.66 |
| Total GDP (2025) | 547.2 billion |
Singapore GDP & Economic Overview
Most Recent Content
Singapore
Transaction Banking
Corridor of Power: China’s Inland Hub Connects to ASEAN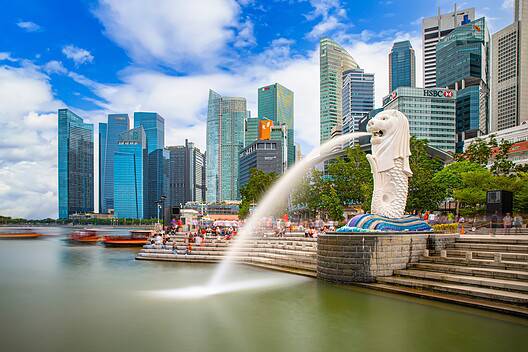
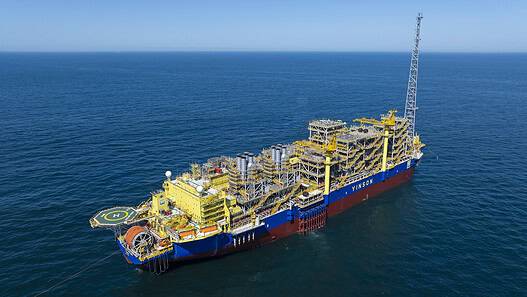
Capital Raising & Corporate Finance
Singapore: Project Bonds Chart Course For Success In FPSO Financing
Banking & Finance
Trade & Investment
| Total Exports | USD 506 billion (2024) |
|---|---|
| Leading Exports |
Integrated Circuits Refined Petroleum Machinery Vaccines Gold |
| Total Imports | USD 459 billion (2024) |
| Leading Imports |
Integrated Circuits Refined Petroleum Crude Petroleum Gold Gas Turbines |
Source: IMF, CIA The World Factbook
Singapore Leading Companies
| Oversea-Chinese Banking Corp (OCBC) | Financials |
|---|---|
| DBS Group | Financials |
| Wilmar International | Consumer Staples, Agricultural Products |
| Olam Group | Consumer Staples, Agricultural Products & Processing |
| SingTel | Telecommunication Services |
| Singapore Airlines | Transportation, Airlines |
Major Trade Partners — Import
| China | 13.9% |
|---|---|
| United States | 12.3% |
| Other Asia | 11.5% |
| Malaysia | 11.3% |
| South Korea | 6..07% |
Major Trade Partners — Export
| China | 13.8% |
|---|---|
| Hong Kong SAR | 10.61% |
| United States | 9.45% |
| Malaysia | 9.35% |
| Indonesia | 7.44% |
Global Finance Rankings & Awards


Data Sources:
UN World Population Prospects
World Inequality Report
S&P Global Ratings
Moody’s
Fitch Ratings
IMF Direction of Trade Statistics (DOTS)
UN Conference on Trade and Development (UNCTAD)
CIA The World Factbook
World Bank’s World Integrated Trade Solution
Forbes Global 2000