Includes historical data for Slovenia’s Gross Domestic Product growth, debt-to-GDP ratio and more, as well as information on trade, banking and financial sector leadership.
A Diversified Economy That Benefits From Excellent Infrastructure
Following its independence from Yugoslavia in 1991, Slovenia achieved remarkable socio-economic progress, with substantial increases in per-capita income, declining unemployment rates, and improvements in fiscal accounts.
Strategically positioned between Central Europe and the Balkans markets, with its excellent infrastructure and well-educated labor force this country of a little more than 2 million is an attractive foreign investment destination. A member of the EU and the Eurozone, the automotive, consumer electronics, pharmaceutical and tourism sectors are the main drivers of its diversified economy.
However, the Slovenian business environment also faces challenges. These include heavy dependence on exports, vulnerability to the economic fortunes of trading partners, and reliance on energy imports. Additionally, despite some progress, corruption, bureaucratic hurdles and susceptibility to political interference in the judicial system remain ongoing issues.
Macroeconomy & Sovereign Data
| Type of Government | Parliamentary republic |
|---|---|
| Capital | Ljubljana |
| Sovereign Ratings |
S&P: AA– Moody’s: A3 Fitch: A |
| Total Population | 2.1 million |
| Median Age | 44.3 |
| Adult Per Capita Income (PPP) | 49,290.04 |
| Total GDP (2023) | 72.1 billion |
Slovenia GDP & Economic Overview
Most Recent Content
Slovenia
Emerging & Frontier Markets
Slovenia: Arms Open Wide To The West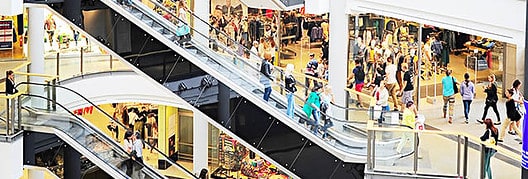
Economics, Policy & Regulation
CENTRAL AND EASTERN EUROPE: CONSUMPTION RESUMESAwards
BEST BANKS 2014: EUROPECapital Raising & Corporate Finance
ANNUAL SURVEY: WORLD’S BEST BANKS 2014Banking & Finance
Trade & Investment
| Total Exports | USD 68.6 billion (2023) |
|---|---|
| Leading Exports |
Packaged Medicines Cars And Vehicle Parts Refined Petroleum Electrical Lighting/Signaling Equipment Electricity |
| Total Imports | USD 59.6 billion (2022) |
| Leading Imports |
Packaged Medicines Cars And Vehicle Parts Refined Petroleum Delivery Trucks Electricity |
| Source: | World Integrated Trade Solution |
Slovenia Leading Companies
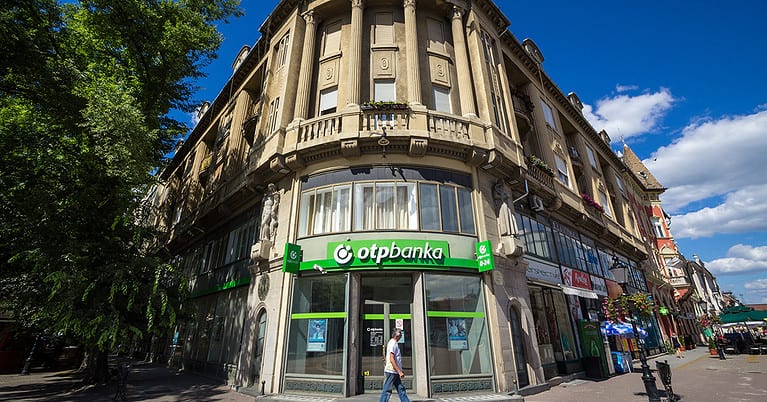
| Nova Ljubljanska Banka | Financials |
|---|---|
| Zavarovalnica Triglav | Insurance |
| Petrol Group | Oil, Gas & Consumable Fuels |
| Telekom Slovenije | Telecommunication Services |
| Gorenje | Consumer Discretionary, Household Durables |
| Krka | Pharmaceuticals |
| Laško Brewery | Consumer Staples, Breweries |
Major Trade Partners — Import
| Germany | 13% |
|---|---|
| China | 13% |
| Switzerland | 11% |
| Italy | 11% |
| Austria | 7% |
Source: World Integrated Trade Solution
Major Trade Partners — Export
| Germany | 18% |
|---|---|
| Switzerland | 13% |
| Italy | 11% |
| Croatia | 8% |
| Austria | 6% |
Source: World Integrated Trade Solution
Global Finance Rankings & Awards

Data Sources:
UN World Population Prospects
World Inequality Report
S&P Global Ratings
Moody’s
Fitch Ratings
IMF Direction of Trade Statistics (DOTS)
UN Conference on Trade and Development (UNCTAD)
CIA The World Factbook
World Bank’s World Integrated Trade Solution
Forbes Global 2000