Includes historical data for Somalia’s Gross Domestic Product growth, debt-to-GDP ratio and more, as well as information on trade, banking and financial sector leadership.
Instability Damages Economic Potential
Since gaining independence in 1960, Somalia has faced significant turmoil, including the overthrow of its government in 1991, leading to decades of civil war and lawlessness. Efforts to foster social and governance stability continue to this day amid political fragmentation, ongoing conflict, humanitarian crises, and challenges from Al-Shabab insurgents in the southern part of the country.
Agriculture, livestock and fishing remain economic mainstays. Despite the potential in various sectors, including energy, digital technologies, education and health, the business environment is not conducive to attracting investment and fostering innovation. The country ranks among the nations with the lowest living standards globally, with many Somalis relying on remittances and international aid to sustain their livelihoods.
Macroeconomy & Sovereign Data
| Type of Government | Federal parliamentary republic |
|---|---|
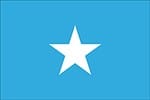
| Capital | Mogadishu |
| Sovereign Ratings |
S&P: Not rated Moody’s: Not rated Fitch: Not rated |
| Total Population | 16.5 million |
| Median Age | 15.3 |
| Adult Per Capita Income (PPP) | 3,343.25 |
| Total GDP (2023) | 12.8 billion |
Somalia GDP & Economic Overview
Most Recent Content
Somalia
Economics, Policy & Regulation
Somalia: Debt Relief Breakthrough
Capital Raising & Corporate Finance
Somalia Returns To The Global Banking Scene
Banking
The 411 on Anti-Money-Laundering
Emerging & Frontier Markets
Investors Wary In Run-Up to Kenya’s Presidential ElectionBanking & Finance
Trade & Investment
| Total Exports | USD 4.0 billion (2023) |
|---|---|
| Leading Exports |
Gold Sheep Goats Sesame Seeds Insect Resins Cattle |
| Total Imports | USD 0.7 billion (2022) |
| Leading Imports |
Cigarettes Raw Sugar Rice Broadcasting Equipment Textiles |
| Source: | World Integrated Trade Solution |
Somalia Leading Companies
| International Bank of Somalia | Financials |
|---|---|
| Salaam Somali Bank | Financials |
| Premier Bank | Financials |
| Hormuud | Telecommunication Services |
| Trans-National Industrial Electricity and Gas Company | Utilities |
| Somaliland Beverage Industries | Consumer Staples, Beverages |
| Albayrak Group | Transportation Infrastructure Services |
Global Finance Rankings & Awards


Data Sources:
UN World Population Prospects
World Inequality Report
S&P Global Ratings
Moody’s
Fitch Ratings
IMF Direction of Trade Statistics (DOTS)
UN Conference on Trade and Development (UNCTAD)
CIA The World Factbook
World Bank’s World Integrated Trade Solution
Forbes Global 2000