Includes historical data for South Korea’s Gross Domestic Product growth, debt-to-GDP ratio and more, as well as information on trade, banking and financial sector leadership.
A High-Tech Economy With A Vibrant Private Sector
Following the 1950-53 conflict with North Korea, South Korea launched a major industrial development program, laying the groundwork for what would become a remarkable economic success story. Today, South Korea stands tall in the ranks of major economies, driven by a vibrant private sector, a skilled workforce and a world-class infrastructure.
An attractive destination for foreign direct investment (FDI), despite its strengths, the business environment is not devoid of challenges. Weaknesses include regulatory intricacies, an aging population, and heavy reliance on exports. The dominance of family-owned chaebol conglomerates, competition from China, and geopolitical tensions with North Korea, pose additional concerns.
Macroeconomy & Sovereign Data
| Type of Government | Presidential republic |
|---|---|
| Capital | Seoul |
| Sovereign Ratings |
S&P: AA Moody’s: Aa2 Fitch: AA– |
| Total Population | 51.5 million |
| Median Age | 44.5 |
| Adult Per Capita Income (PPP) | 51,526.78 |
| Total GDP (2023) | 1.8 trillion |
South Korea GDP & Economic Overview
Most Recent Content
South Korea
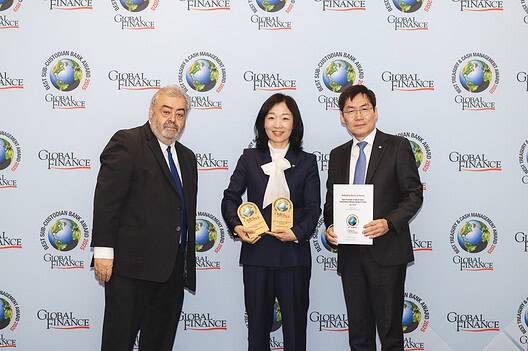
Award Ceremonies and Events
Video Interview: IBK’s Deputy CEO – Hyung Il Kim
Economics, Policy & Regulation
Asia-Pacific: Economic Growth Taking Off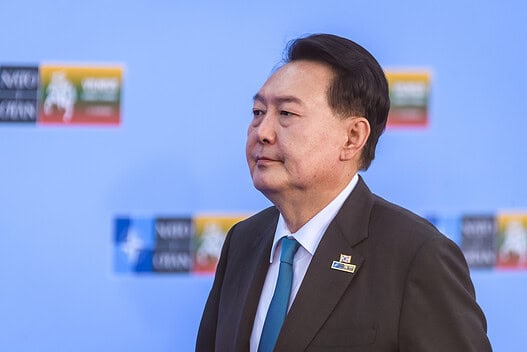
Economics, Policy & Regulation
South Korea: From Prosecutor To President To Pariah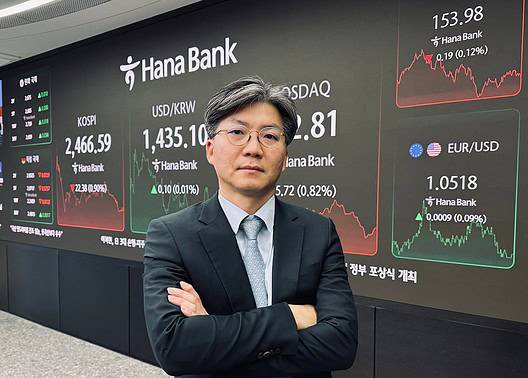
Winner Insights
Hana Bank’s Head Of FX & Derivatives Sales On Navigating…Banking & Finance
Trade & Investment
| Total Exports | USD 677.5 billion (2022) |
|---|---|
| Leading Exports |
Integrated Circuits Cars And Vehicle Parts Refined Petroleum Office Machinery Ships Telephones |
| Total Imports | USD 797.7 billion (2022) |
| Leading Imports |
Crude Oil Integrated Circuits Natural Gas Refined Petroleum Photo Lab Equipment Cars Iron |
| Source: | IMF, CIA The World Factbook |
South Korea Leading Companies
| Kookmin Bank | Financials |
|---|---|
| Shinhan Bank | Financials |
| KEB Hana Bank | Financials |
| Samsung Electronics | Technology, Semiconductors, Consumer Electronics |
| Hyundai Motor Company | Consumer Discretionary, Automobiles & Components |
| Lotte Group | Conglomerates, Food & Staples Retailing, Hotels, Restaurants & Leisure |
| LG Corporation | Consumer Discretionary, Consumer Electronics |
Major Trade Partners — Import
| China | 22.5% |
|---|---|
| United States | 12.0% |
| Japan | 8.9% |
| Australia | 5.4% |
| Saudi Arabia | 4.0% |
Major Trade Partners — Export
| China | 25.3% |
|---|---|
| United States | 14.9% |
| Vietnam | 8.8% |
| Hong Kong | 5.8% |
| Japan | 4.7% |
Global Finance Rankings & Awards


Data Sources:
UN World Population Prospects
World Inequality Report
S&P Global Ratings
Moody’s
Fitch Ratings
IMF Direction of Trade Statistics (DOTS)
UN Conference on Trade and Development (UNCTAD)
CIA The World Factbook
World Bank’s World Integrated Trade Solution
Forbes Global 2000