
Includes historical data for Sri Lanka’s Gross Domestic Product growth, debt-to-GDP ratio and more, as well as information on trade, banking and financial sector leadership.
High Debt Hampers Economic Growth
In 2022, an economic crisis swept across Sri Lanka. The currency collapsed and inflation soared, fueling political unrest and a humanitarian emergency marked by severe shortages of essential goods. Since then, the economy has steadied somewhat, with tourism arrivals reaching record highs. Efforts to reposition Sri Lanka as a knowledge-based, export-oriented hub have also been revived.
Sri Lanka enjoys a strategic location at the crossroads of trade routes linking Asia and the Middle East, and boasts a diverse economic base spanning agriculture, manufacturing, construction, as well as finance, telecommunications and IT services. However, while potentially very attractive to foreign investors, the business climate in Sri Lanka also suffers from political influence, burdensome regulatory frameworks, and rigid labor regulations. The government’s high debt payments resulting from heavy reliance on imports and an inflated civil service, vulnerability to climate disasters, and ethnic tensions further compound Sri Lanka’s economic woes.
Macroeconomy & Sovereign Data
| Type of Government | Presidential republic |
|---|---|
| Capital | Colombo (commercial capital); Sri Jayewardenepura Kotte (legislative capital) |
| Sovereign Ratings |
S&P: CCC+ Moody’s: Caa1 Fitch: CCC |
| Total Population | 22.9 million |
| Median Age | 33 |
| Adult Per Capita Income (PPP) | 20,254.23 |
| Total GDP (2025) | n/a |
Sri Lanka GDP & Economic Overview
Most Recent Content
Sri Lanka
Economics, Policy & Regulation
Central Banker Report Cards 2024: Asia-Pacific
Economics, Policy & Regulation
Sri Lanka: New President Wins In An Upset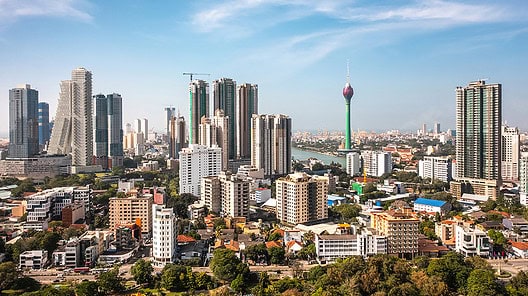
Emerging & Frontier Markets
Sri Lanka: Recovery Takes Hold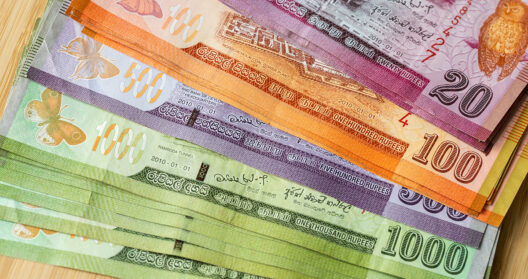
Emerging & Frontier Markets
Sri Lanka: IMF Approves BailoutBanking & Finance
Trade & Investment
| Total Exports | USD 12.1 billion (2024) |
|---|---|
| Leading Exports |
Garments Tea Precious Stones Used Rubber Tires Rubber Products |
| Total Imports | USD 18.4 billion (2024) |
| Leading Imports |
Refined Petroleum Fabric Crude Petroleum Packaged Medicine Cotton Fabric |
| Source: | IMF, CIA The World Factbook |
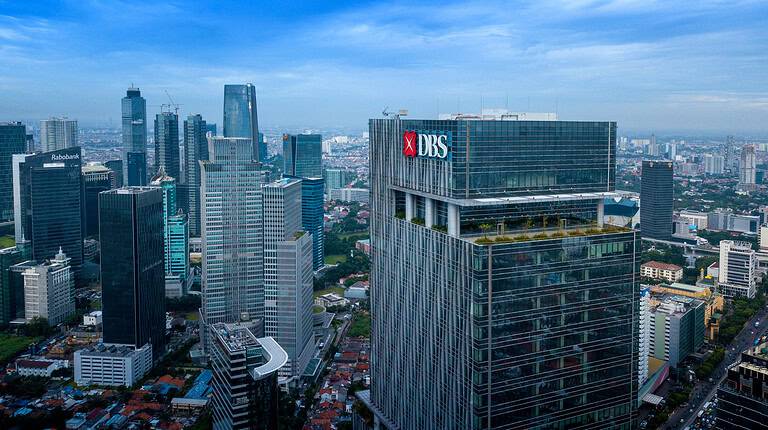
Sri Lanka Leading Companies
| Bank of Ceylon | Financials |
|---|---|
| People's Bank | Financials |
| Commercial Bank of Ceylon | Financials |
| John Keells Holdings | Conglomerates, Food & Staples Retailing, Hotels, Restaurants & Leisure |
| Sri Lanka Telecom | Telecommunication Services |
| Ceylon Petroleum Corporation | Energy, Oil & Gas Refining & Marketing |
| Hayleys | Conglomerates, Industrials, Construction & Engineering, Transportation |
Major Trade Partners — Import
| India | 19.5% |
|---|---|
| China | 18.9% |
| United Arab Emirates | 9.51% |
| Singapore | 5.33% |
| Malaysia | 0.05% |
Major Trade Partners — Export
| United States | 23.16% |
|---|---|
| United Kingdom | 7.14% |
| India | 7.14% |
| Italy | 5.68% |
| Germany | 5.01% |
Global Finance Rankings & Awards


Data Sources:
UN World Population Prospects
World Inequality Report
S&P Global Ratings
Moody’s
Fitch Ratings
IMF Direction of Trade Statistics (DOTS)
UN Conference on Trade and Development (UNCTAD)
CIA The World Factbook
World Bank’s World Integrated Trade Solution
Forbes Global 2000