Includes historical data for Sweden’s Gross Domestic Product growth, debt-to-GDP ratio and more, as well as information on trade, banking and financial sector leadership.
An Export-Oriented Economy With Low Corporate Taxes
Sweden’s economy is export-oriented, highly diversified, and competitive, making it the largest among Nordic nations. With a population of close to 11 million people, the country boasts a high standard of living, extensive welfare benefits, and a well-educated labor force. Furthermore, its stable political environment, low levels of corporate tax, and regulatory efficiency make it a preferred destination for foreign direct investment.
However, Sweden also faces challenges, including vulnerability to fluctuations in global demand, substantial household debt and labor regulations among Europe’s most stringent. Additionally, while the exceptional influx of migrants represents a positive demographic shift, their successful integration into Swedish society and economy remains a critical issue.
Macroeconomy & Sovereign Data
| Type of Government | Parliamentary constitutional monarchy |
|---|---|
| Capital | Stockholm |
| Sovereign Ratings |
S&P: AAA Moody’s: AAA Fitch: AAA |
| Total Population | 10.7 million |
| Median Age | 39.8 |
| Adult Per Capita Income (PPP) | 73,037.05 |
| Total GDP (2023) | 623.1 billion |
Sweden GDP & Economic Overview
Most Recent Content
Sweden
Capital Raising & Corporate Finance
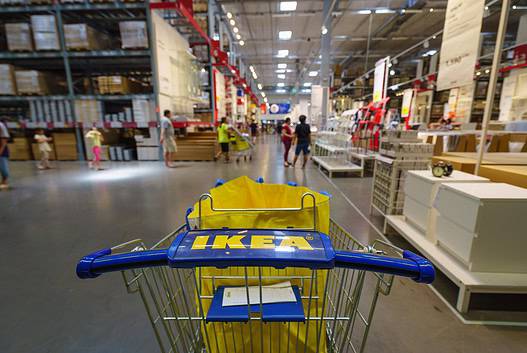
IKEA: First Non-Swedish Executive Named To Lead Retailer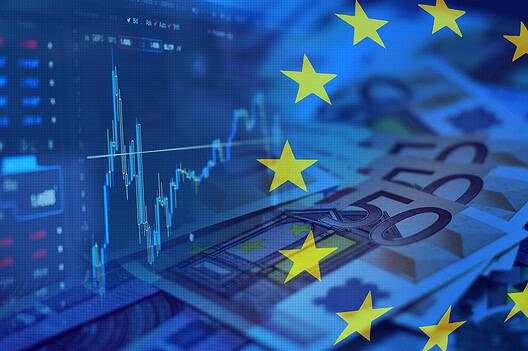
Economics, Policy & Regulation
Central Banker Report Cards 2024: Europe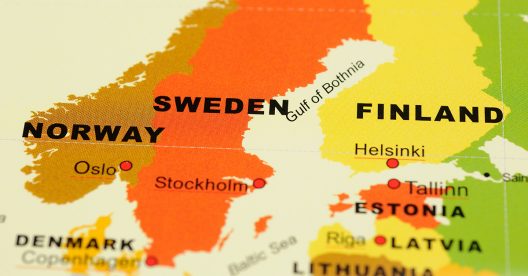
Technology
Nordic Lure For Data Center Investors
Banking & Finance
Trade & Investment
| Total Exports | USD 187.1 billion (2023) |
|---|---|
| Leading Exports |
Cars And Vehicle Parts Refined Petroleum Packaged Medicines Lumber Iron Broadcasting Equipment |
| Total Imports | USD 203.7 billion (2022) |
| Leading Imports |
Cars And Vehicle Parts Crude Petroleum Refined Petroleum Broadcasting Equipment Computers |
| Source: | World Integrated Trade Solution |
Sweden Leading Companies
| Svenska Handelsbanken | Financials |
|---|---|
| SEB AB | Financials |
| Swedbank | Financials |
| Volvo Group | Transport Manufacturing |
| Ericsson | Technology |
| Telia | Media and Communications |
| H&M – Hennes & Mauritz | Apparel and Textiles |
Major Trade Partners — Import
| Germany | 17% |
|---|---|
| Norway | 10% |
| Netherlands | 10% |
| Denmark | 7% |
| China | 7% |
Source: World Integrated Trade Solution
Major Trade Partners — Export
| Norway | 11% |
|---|---|
| Germany | 10% |
| United States | 8% |
| Denmark | 8% |
| Finland | 7% |
Source: World Integrated Trade Solution
Global Finance Rankings & Awards


Data Sources:
UN World Population Prospects
World Inequality Report
S&P Global Ratings
Moody’s
Fitch Ratings
IMF Direction of Trade Statistics (DOTS)
UN Conference on Trade and Development (UNCTAD)
CIA The World Factbook
World Bank’s World Integrated Trade Solution
Forbes Global 2000