
Includes historical data for Syria’s Gross Domestic Product growth, debt-to-GDP ratio and more, as well as information on trade, banking and financial sector leadership.
Economy Wrecked By A Decade Of War
Ruled by the Assad family since 1970, Syria has been grappling with a protracted civil war between the government led by President Bashar al-Assad and a variety of opposition groups. As a result, according to the World Bank, more than half the pre-conflict population of almost 21 million has been displaced, either within the country or as refugees, while the GDP saw a decline of more than 50% from 2010 to 2020.
Amid widespread destruction of infrastructure, the situation has been exacerbated by the Covid-19 pandemic, international sanctions, and significant capital flight of Syrians moving their money abroad.
Policy-making has prioritized preserving the regime and its military capabilities, further crippling the economy and leaving regions ravaged by war with virtually non-existent job markets.
Macroeconomy & Sovereign Data
| Type of Government | Presidential republic |
|---|---|
| Capital | Damascus |
| Sovereign Ratings |
S&P: Not rated Moody’s: Not rated Fitch Ratings: Not rated |
| Total Population | N/A |
| Median Age | 22.8 |
| Adult Per Capita Income (PPP) | 4,830.32 |
| Total GDP (2023) | N/A |
Most Recent Content
Syria
Economics, Policy & Regulation
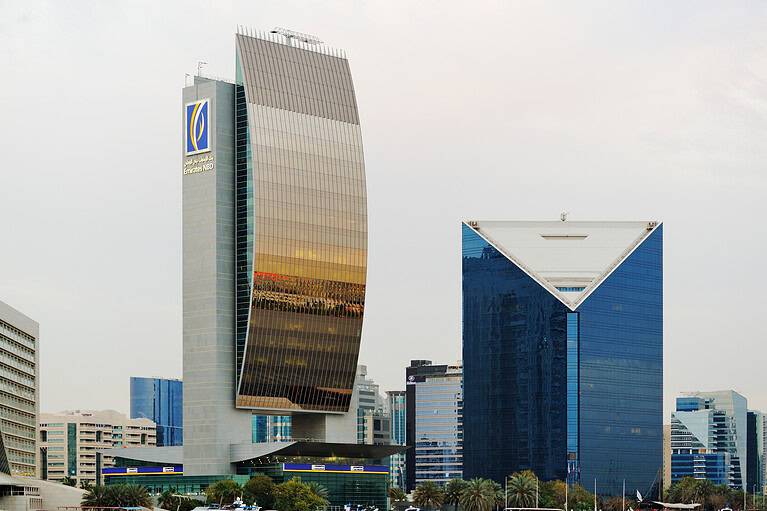
With Lifting Of US Sanctions, Syrian Banks Reconnect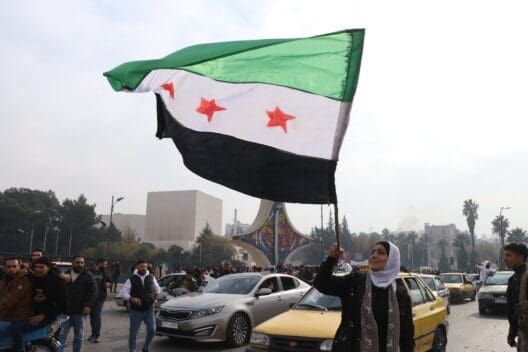
Economics, Policy & Regulation
Syria: If Sanctions Are Lifted, Will Syria ‘Shine?’
Economics, Policy & Regulation
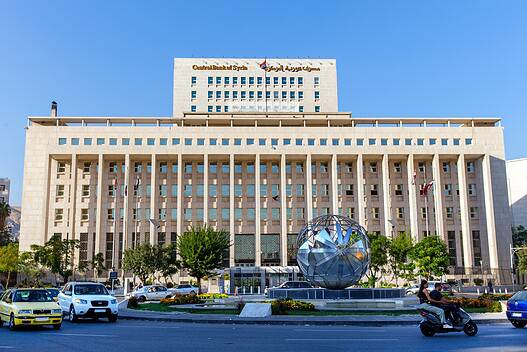
Syria Appoints First Woman As Central Bank Governor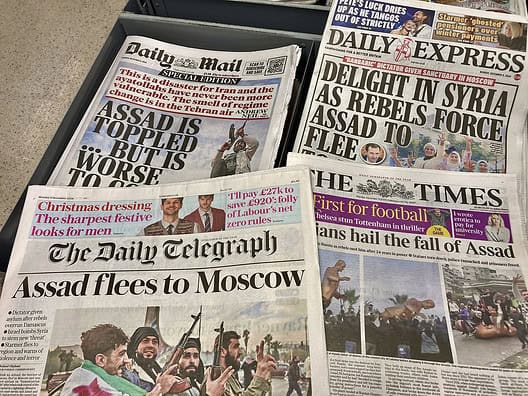
Economics, Policy & Regulation
Syria’s Finance Minister: Country Ready For Return To NormalcyBanking & Finance
Trade & Investment
| Total Exports | USD 4.8 billion (2023) |
|---|---|
| Leading Exports |
Pure Olive Oil Nuts Phosphates Cotton Garments |
| Total Imports | USD 1.6 billion (2022) |
| Leading Imports |
Tobacco Plastics Wheat Seed Oils Plastic Products |
| Source: | World Integrated Trade Solution |
Syria Leading Companies
| Syrian Petroleum Company | Oil & Gas Exploration & Production |
|---|---|
| Commercial Bank of Syria | Financials |
| Real Estate Bank | Financials |
| Syriatel | Telecommunication Services |
| Cham Group | Conglomerate, Real Estate, Financials, Hospitality |
| Omran | Materials, Building Products |
| Syrian Airlines | Airlines |
Global Finance Rankings & Awards


Data Sources:
UN World Population Prospects
World Inequality Report
S&P Global Ratings
Moody’s
Fitch Ratings
IMF Direction of Trade Statistics (DOTS)
UN Conference on Trade and Development (UNCTAD)
CIA The World Factbook
World Bank’s World Integrated Trade Solution
Forbes Global 2000