
Includes historical data for Tanzania’s Gross Domestic Product growth, debt-to-GDP ratio and more, as well as information on trade, banking and financial sector leadership.
Sustained Growth Fostered By Long-Term Political Stability
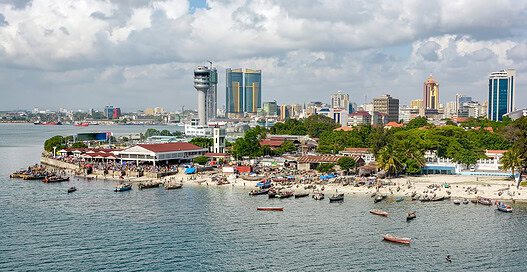
Considered one of the most politically stable nations on the continent, the United Republic of Tanzania achieved lower-middle-income country status in 2020 after experiencing two decades of sustained economic expansion. Its effective governance, sound fiscal policies, abundant natural resources, and strategic location along the Indian Ocean have fostered a resilient and diverse economy and contributed to poverty alleviation efforts.
Gold, copper and other minerals constitute Tanzania’s primary drivers of export revenue. Additionally, the country holds significant gas potential from offshore reserves discovered in 2010 and welcomes foreign investment in sectors such as information and communications technology, infrastructure, energy and mining, financial services, manufacturing and tourism (Tanzania is home to Africa’s highest mountain, Kilimanjaro, and renowned national parks like the Serengeti).
However, the Tanzanian business environment faces challenges, including complex bureaucracy, inefficiencies in electricity and transport infrastructure, an underdeveloped legal framework, and corruption. The country also grapples with lingering high poverty rates and vulnerability to commodity price fluctuations and climate conditions.
Macroeconomy & Sovereign Data
| Type of Government | Presidential republic |
|---|---|
| Capital | Dar es Salaam (administrative capital), Dodoma (legislative capital) |
| Sovereign Ratings |
S&P: Not rated Moody’s: B1 Fitch: B+ |
| Total Population | 65.2 million |
| Median Age | 17.2 |
| Adult Per Capita Income (PPP) | 6,081.86 |
| Total GDP (2023) | 79.6 billion |
Tanzania GDP & Economic Overview
Most Recent Content
Tanzania
Emerging & Frontier Markets
Tanzania: East Africa’s New Powerhouse
Economics, Policy & Regulation
Central Banker Report Cards 2024: Africa And The Middle East
Economics, Policy & Regulation
Tanzania: Winshear Gold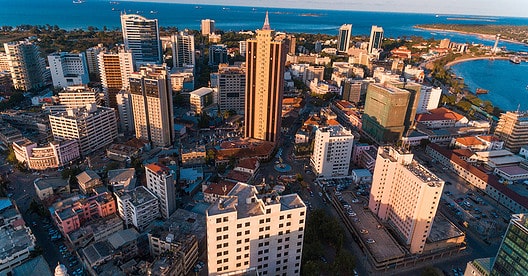
Emerging & Frontier Markets
Tanzania: Priming Commercial PossibilitiesBanking & Finance
Trade & Investment
| Total Exports | USD 22.7 billion (2023) |
|---|---|
| Leading Exports |
Gold Cashews Copper Precious Metals Legumes |
| Total Imports | USD 9.4 billion (2022) |
| Leading Imports |
Copper Refined Petroleum Packaged Medicines Palm Oil Wheat |
| Source: | World Integrated Trade Solution |
Tanzania Leading Companies
| CRDB Bank | Financials |
|---|---|
| National Microfinance Bank | Financials |
| Metl Group | Consumer Staples, Food Products |
| Tanzania Electric Supply Co. | Utilities |
| Tanzania Breweries Limited | Consumer Staples, Brewers |
| Tanzania Portland Cement Company | Materials, Building Products |
Major Trade Partners — Import
| China | 25% |
|---|---|
| United Arab Emirates | 13% |
| India | 11% |
| Saudi Arabia | 6% |
| Japan | 4% |
Source: World Integrated Trade Solution
Major Trade Partners — Export
| United Arab Emirates | 16% |
|---|---|
| India | 16% |
| South Africa | 14% |
| Switzerland | 8% |
| Kenya | 6% |
Source: World Integrated Trade Solution
Global Finance Rankings & Awards


Data Sources:
UN World Population Prospects
World Inequality Report
S&P Global Ratings
Moody’s
Fitch Ratings
IMF Direction of Trade Statistics (DOTS)
UN Conference on Trade and Development (UNCTAD)
CIA The World Factbook
World Bank’s World Integrated Trade Solution
Forbes Global 2000