Includes historical data for Democratic Republic of the Congo’s Gross Domestic Product growth, debt-to-GDP ratio and more, as well as information on trade, banking and financial sector leadership.
Economic Potential Hampered By Wars And Political Instability
The Democratic Republic of the Congo (DRC) is the second-largest nation in sub-Saharan Africa, with a rapidly growing population of more than 100 million. The DRC is endowed with exceptional natural resources, including mineral deposits of copper, cobalt, diamonds and gold; significant hydroelectric capacity; extensive fertile land; rich biodiversity, and the world’s second-largest tropical rainforest. Its strategic location in the heart of Africa contributes to making it a potentially attractive destination for foreign investors.
Despite these strengths, the country is still recovering from a series of civil wars that broke out in the 1990s and claimed up to six million lives. Economic development remains hampered by instability, violence, and weak rule of law. Inadequate transport, energy and telecommunications infrastructure, and poverty rates among the highest in the world, further restrict the nation’s ability to reach its full socio-economic potential.
Macroeconomy & Sovereign Data
| Type of Government | Semi-presidential republic |
|---|---|
| Capital | Kinshasa |
| Sovereign Ratings |
S&P: B– Moody’s: B3 Fitch: Not rated |
| Total Population | 103.2 million |
| Median Age | 15.6 |
| Adult Per Capita Income (PPP) | 3,050.40 |
| Total GDP (2023) | 73.8 billion |
Democratic Republic of the Congo GDP & Economic Overview
Most Recent Content
The Democratic Republic of the Congo
Emerging & Frontier Markets
Democratic Republic of Congo: Waiting For The Peace Dividend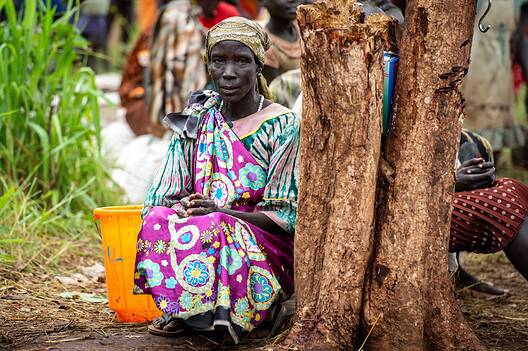
Economic Data
Poorest Countries in the World 2025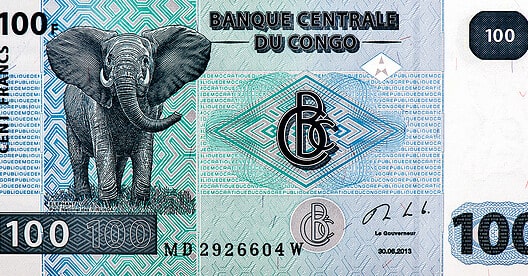
Emerging & Frontier Markets
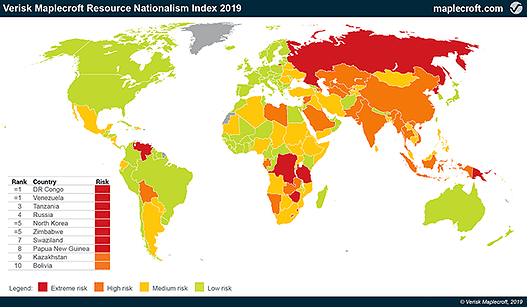
Rising Nationalism Threatens Extractive Industries In Russia, Venezuela And Other…Banking & Finance
Trade & Investment
| Total Exports | USD 13.3 billion (2023) |
|---|---|
| Leading Exports |
Copper Cobalt Crude Petroleum Tin Diamonds |
| Total Imports | USD 22.5 billion (2022) |
| Leading Imports |
Packaged Medicines Refined Petroleum Sulfuric Acid Stone Processing Machines Delivery Trucks |
| Source: | World Integrated Trade Solution |
Democratic Republic of the Congo Leading Companies
| Rawbank | Financials |
|---|---|
| Kibali Gold Mine | Materials, Metals & Mining |
| Gécamines | Materials, Metals & Mining |
| Altech Group | Utilities |
| Equity Banque Commerciale du Congo | Financials |
| Cohydro | Integrated Oil & Gas |
| Feronia | Consumer Staples, Food Production |
Major Trade Partners — Import
| China | 27% |
|---|---|
| South Africa | 13% |
| United States | 9% |
| India | 7% |
| United Arab Emirates | 4% |
Source: World Integrated Trade Solution
Major Trade Partners — Export
| China | 47% |
|---|---|
| Tanzania | 9% |
| South Africa | 9% |
| Singapore | 9% |
| Zambia | 6% |
Source: World Integrated Trade Solution
Global Finance Rankings & Awards


Data Sources:
UN World Population Prospects
World Inequality Report
S&P Global Ratings
Moody’s
Fitch Ratings
IMF Direction of Trade Statistics (DOTS)
UN Conference on Trade and Development (UNCTAD)
CIA The World Factbook
World Bank’s World Integrated Trade Solution
Forbes Global 2000