
Includes historical data for Philippines’ Gross Domestic Product growth, debt-to-GDP ratio and more, as well as information on trade, banking and financial sector leadership.
Consumer Demand Drives Growth
With increasing urbanization, a burgeoning middle class, and a large and young population fluent in English, the World Bank notes, the Philippines’ economic dynamism is rooted in strong consumer demand, a vibrant labor market, and robust remittances from over 10 million Filipino workers and migrants living abroad. In particular, the private sector thrives in the business process outsourcing, retail, real estate and tourism industries.
In recent years, the government has also pursued legislative reforms to improve the business climate and streamline the regulatory environment, thereby bolstering foreign direct investment especially in manufacturing, financial services, and information and communications technology. However, weaknesses persist, including governance shortcomings and lack of transparency, inadequate infrastructure, energy dependence, income inequality, high levels of underemployment, and vulnerability to natural disasters.
Philippines GDP & Economic Overview
Macroeconomy & Sovereign Data
| Type of Government | Presidential republic |
|---|---|
| Capital | Manila |
| Sovereign Ratings |
S&P: BBB+ Moody’s: Baa2 Fitch: BBB |
| Total Population | 114.2 million |
| Median Age | 25 |
| Adult Per Capita Income (PPP) | 15,620.98 |
| Total GDP (2023) | USD 475.9 billion |
Most Recent Content
The Philippines
Award Ceremonies and Events
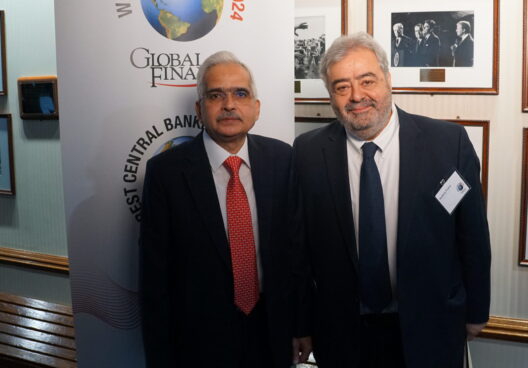
Global Finance’s Central Bank Report Cards, Interviews With A Grade…
Economics, Policy & Regulation
Data-Driven Policy Decisions: Q&A With Philippines Central Bank Governor Eli…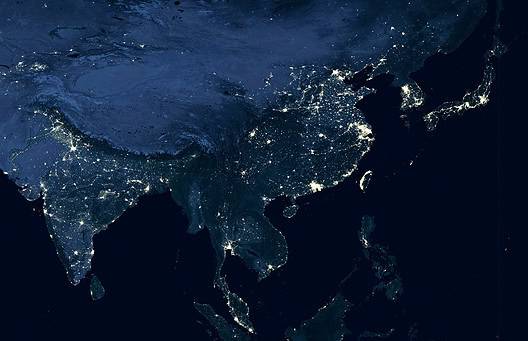
Economics, Policy & Regulation
Central Banker Report Cards 2024: Asia-Pacific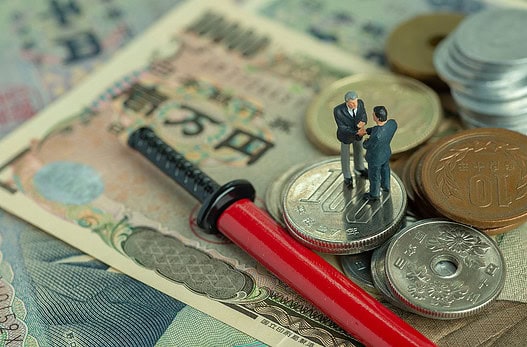
Economics, Policy & Regulation
The Philippines: New Samurai Bond Issue’s Political BackdropBanking & Finance
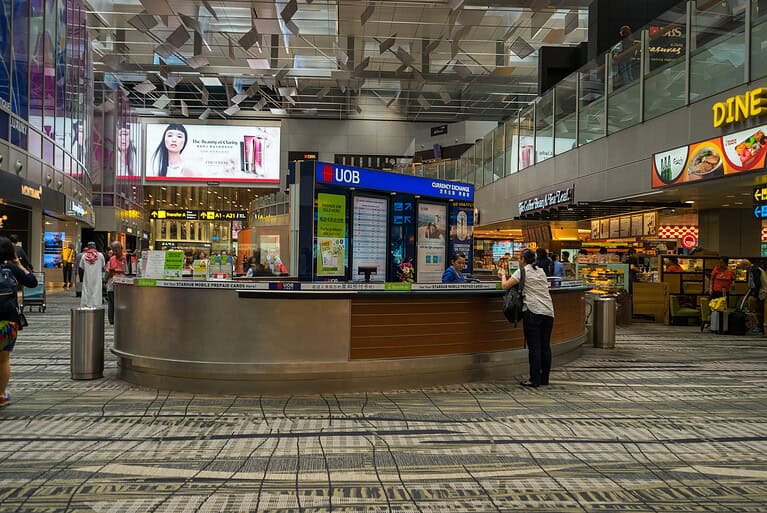
Trade & Investment
| Total Exports | USD 186.5 billion (2022) |
|---|---|
| Leading Exports |
Integrated Circuits Office Machinery/Parts Insulated Wiring Transformers Semiconductors |
| Total Imports | USD 122.6 billion (2022) |
| Leading Imports |
Integrated Circuits Refined Petroleum Cars Crude Petroleum Broadcasting Equipment |
Source: IMF, CIA The World Factbook
Philippines Leading Companies
| Banco de Oro Unibank | Financials |
|---|---|
| Metropolitan Bank & Trust Company (Metrobank) | Financials |
| Top Frontier Investment Holdings | Conglomerates, Metals & Mining, Real Estate, Food Products |
| SM Investments Corporation | Conglomerates, Financials, Retail, Real Estate Management & Development |
| Cebu Pacific Air | Transportation, Airlines |
| Philippine Long Distance Telephone Company (PLDT) | Telecommunication Services |
| Petron Corporation | Energy, Oil & Gas, Refining & Marketing |
Major Trade Partners — Import
| China | 22.7% |
|---|---|
| Japan | 9.5% |
| South Korea | 7.7% |
| Indonesia | 7.3% |
| United States | 6.7% |
Major Trade Partners — Export
| United States | 15.9% |
|---|---|
| China | 15.5% |
| Japan | 14.4% |
| Hong Kong | 13.3% |
| Singapore | 5.6% |
Global Finance Rankings & Awards


Data Sources:
UN World Population Prospects
World Inequality Report
S&P Global Ratings
Moody’s
Fitch Ratings
IMF Direction of Trade Statistics (DOTS)
UN Conference on Trade and Development (UNCTAD)
CIA The World Factbook
World Bank’s World Integrated Trade Solution
Forbes Global 2000