Includes historical data for Seychelles’ Gross Domestic Product growth, debt-to-GDP ratio and more, as well as information on trade, banking and financial sector leadership.
Fisheries And Tourism Power Economic Growth
Located off the eastern coast of Africa in the Indian Ocean, this former British colony consists of an archipelago of 115 islands, with the majority of its 100,000 inhabitants living on the three main islands of Mahé, Praslin, and La Digue. Endowed with unique biodiversity, much of the land is protected as part of nature reserves. Economic growth over the last few decades has been led by tourism and fisheries, attracting significant foreign investment. Today, the archipelago is the most prosperous nation in Sub-Saharan Africa, and its citizens enjoy good healthcare, education and overall quality of life.
Still, the business climate faces challenges. An inefficient regulatory framework, poor access to financing, an underdeveloped formal labor market, and the state’s excessive presence in the economy hinder the emergence of a dynamic private sector beyond the tourism industry. Additionally, its island location makes it especially vulnerable to climate change.
Macroeconomy & Sovereign Data
| Type of Government | Presidential republic |
|---|---|
| Capital | Victoria |
| Sovereign Ratings |
S&P: Not rated Moody’s: Not rated Fitch: BB– |
| Total Population | 0.1 million |
| Median Age | 33.5 |
| Adult Per Capita Income (PPP) | 44,867.44 |
| Total GDP (2023) | 2.2 billion |
Seychelles GDP & Economic Overview
Most Recent Content
The Seychelles


Emerging & Frontier Markets
Global Salon: Francisco FerreiraAward Winners
World’s Best Banks 2013: Africa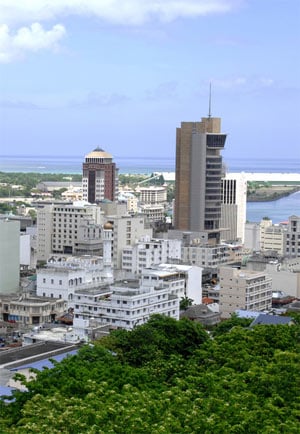
Capital Raising & Corporate Finance
Offshore Deals Help Counter Slowing Global M&A MarketBanking & Finance
Trade & Investment
| Total Exports | USD 1.3 billion (2023) |
|---|---|
| Leading Exports |
Refined Petroleum Fish Recreational Boats Cigarettes Animal Meal |
| Total Imports | USD 0.7 billion (2022) |
| Leading Imports |
Recreational Boats Refined Petroleum Fish Aircraft Cars |
| Source: | World Integrated Trade Solution |
Seychelles Leading Companies
| Development Bank of Seychelles | Financials |
|---|---|
| Nouvobanq | Financials |
| OKX | Information Technology, Fintech |
| Anker Projects | Information Technology, Software & Services |
| Seychelles Petroleum | Oil & Gas Refining & Marketing |
| Seychelles Trading Company | Consumer Discretionary, Multiline Retail |
| Cable & Wireless Seychelles | Telecommunication Services |
Major Trade Partners — Import
| South Africa | 19% |
|---|---|
| Netherlands | 16% |
| United Arab Emirates | 16% |
| Italy | 15% |
| France | 8% |
Source: World Integrated Trade Solution
Major Trade Partners — Export
| Cayman Islands | 15% |
|---|---|
| Bermuda | 12% |
| Belize | 9% |
| France | 7% |
| N/A | N/A |
Source: World Integrated Trade Solution
Global Finance Rankings & Awards


Data Sources:
UN World Population Prospects
World Inequality Report
S&P Global Ratings
Moody’s
Fitch Ratings
IMF Direction of Trade Statistics (DOTS)
UN Conference on Trade and Development (UNCTAD)
CIA The World Factbook
World Bank’s World Integrated Trade Solution
Forbes Global 2000