
Includes historical data for the Trinidad and Tobago’s Gross Domestic Product growth, debt-to-GDP ratio and more, as well as information on trade, banking and financial sector leadership.
Oil And Gas Exports Drive Economic Growth
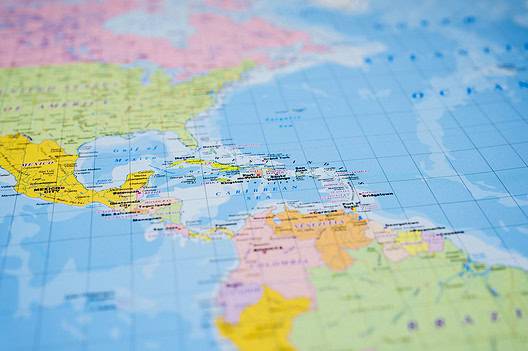
A twin island country off the northern edge of the South American mainland, Trinidad and Tobago boasts a robust economy primarily sustained by its large oil and gas reserves, which account for approximately half the GDP, 80% of export earnings, and attract the lion’s share of foreign investment. The country’s stable democracy, educated English-speaking workforce and well-regulated financial system contribute to its investment appeal and make it one of the wealthiest nations in Latin America. The government is also targeting increased investment and growth in tourism, agriculture, information and communications technology. Trinidad and Tobago maintains a large sovereign wealth fund and is a member of CARICOM, the Caribbean Community.
Despite these strengths, challenges persist. Lack of transparency and burdensome bureaucracy, low labor productivity and inefficient government bureaucracy hinder progress. The over-dependence on oil and gas discourages private-sector development.
Macroeconomy & Sovereign Data
| Type of Government | Parliamentary republic |
|---|---|
| Capital | Port of Spain |
| Sovereign Ratings |
S&P: BBB– Moody’s: Ba2 Fitch: Not rated |
| Total Population | 1.4 million |
| Median Age | 37.0 |
| Adult Per Capita Income (PPP) | 31,815.95 |
| Total GDP (2023) | 28.4 billion |
Trinidad and Tobago GDP & Economic Overview
Most Recent Content
Trinidad and Tobago
Economics, Policy & Regulation
Central Banker Report Cards 2024: The Americas
Capital Raising & Corporate Finance
IPOs Return To Latin America
Economics, Policy & Regulation
Shrinking Lifeline For Trinidad and TobagoCapital Raising & Corporate Finance
ANNUAL SURVEY: WORLD’S BEST BANKS 2014Banking & Finance
Trade & Investment
| Total Exports | USD 5.9 billion (2023) |
|---|---|
| Leading Exports |
Ammonia Industrial Alcohols Natural Gas Crude Petroleum Iron Products Fertilizers |
| Total Imports | USD 22.6 billion (2022) |
| Leading Imports |
Refined Petroleum Iron Excavation Machinery Ships Cars |
| Source: | World Integrated Trade Solution |
Trinidad And Tobago Leading Companies
| Republic Bank Limited | Financials |
|---|---|
| First Citizens Bank Limited (FCB) | Financials |
| National Energy (NGC) | Oil & Gas Exploration & Production |
| Trinidad Cement | Materials |
| Ansa McAL | Conglomerates, Consumer Discretionary, Financials, Industrials |
| Massy Holdings | Conglomerates, Consumer Discretionary, Chemicals, Financials |
| Caribbean Airlines (CAL) | Airlines |
Major Trade Partners — Import
| United States | 35% |
|---|---|
| China | 11% |
| Mexico | 7% |
| Brazil | 6% |
| Canada | 5% |
Major Trade Partners — Export
| United States | 42% |
|---|---|
| Guyana | 7% |
| Mexico | 4% |
| France | 4% |
| Belgium | 4% |
Global Finance Rankings & Awards


Data Sources:
UN World Population Prospects
World Inequality Report
S&P Global Ratings
Moody’s
Fitch Ratings
IMF Direction of Trade Statistics (DOTS)
UN Conference on Trade and Development (UNCTAD)
CIA The World Factbook
World Bank’s World Integrated Trade Solution
Forbes Global 2000