Includes historical data for Ukraine’s Gross Domestic Product growth, debt-to-GDP ratio and more, as well as information on trade, banking and financial sector leadership.
Economy Devastated By Invasion And War
Russia’s full-scale invasion of Ukraine has significantly impacted the country’s economic landscape. However, as most areas of this country of approximately 33 million people—the second-largest in Europe—are not on the frontlines, Ukraine has managed to maintain an impressive degree of entrepreneurial dynamism. Such dynamism is rooted in a large consumer market, abundant natural resources, and a highly educated, cost-effective workforce. Furthermore, the war has not halted but accelerated the push for corporate governance and economic reforms, especially since Ukraine was granted candidate status for EU membership through an accelerated procedure in 2022. Additionally, Ukraine’s post-conflict reconstruction is expected to draw investment estimated in hundreds of billions of dollars from governmental bodies, international financial institutions and the private sector.
Among the top priorities on the agenda, Ukraine will need to confront persistent shortcomings in key areas such as transparency and bureaucratic efficiency. It will also be necessary to develop solutions for the erosion of production capacity and tackle the economy’s insufficient diversification. The demographic decline, worsened by the exodus of large swaths of the population, will pose an additional challenge.
Macroeconomy & Sovereign Data
| Type of Government | Semi-presidential republic |
|---|---|
| Capital | Kyiv |
| Sovereign Ratings |
S&P: CC Moody’s: Ca Fitch: CC |
| Total Population | 33.4 million |
| Median Age | 44.0 |
| Adult Per Capita Income (PPP) | 12,293.92 |
| Total GDP (2023) | 188.9 billion |
Ukraine GDP & Economic Overview
Most Recent Content
Ukraine
Economics, Policy & Regulation
Central Banker Report Cards 2024: Europe
Economics, Policy & Regulation
Responding To Russia: Q&A with Andriy Pyshnyy, Central Bank Governor…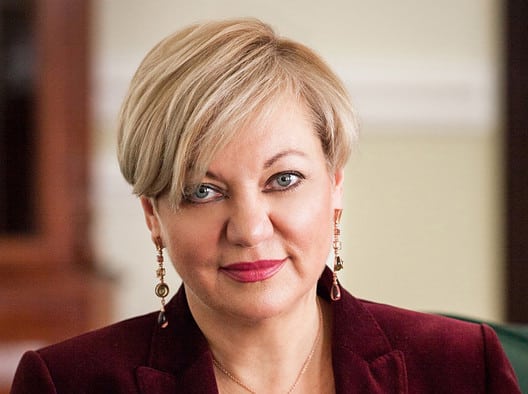
Executive Interviews
Reconstruction Then And Now: Q&A With Former Ukraine National Bank…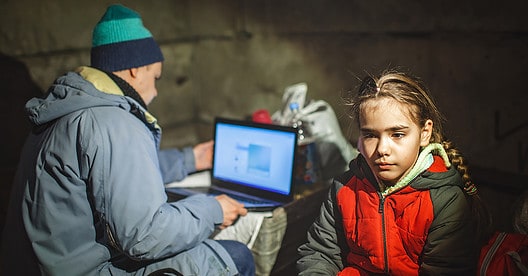
Banking & Finance
Trade & Investment
| Total Exports | USD 63.6 billion (2023) |
|---|---|
| Leading Exports |
Corn Sunflower Seed Oils Iron/Iron Products Wheat Insulated Wiring Rapeseed |
| Total Imports | USD 55.7 billion (2022) |
| Leading Imports |
Refined Petroleum Cars Natural Gas Packaged Medicines Coal Broadcasting Equipment |
| Source: | World Integrated Trade Solution |
Ukraine Leading Companies
| PrivatBank | Financials |
|---|---|
| State Savings Bank of Ukraine | Financials |
| Metinvest | Metals & Mining |
| Ukrtelecom | Telecommunication Services |
| Kernel Group | Consumer Discretionary, Broadline Retail |
| MHP | Consumer Staples, Food Products |
| Ukrnafta | Oil & Gas Exploration & Production |
Major Trade Partners — Import
| China | 15% |
|---|---|
| Germany | 9% |
| Russia | 8% |
| Poland | 7% |
| Belarus | 7% |
Source: World Integrated Trade Solution
Major Trade Partners — Export
| China | 12% |
|---|---|
| Poland | 8% |
| Türkiye | 6% |
| Russia | 5% |
| Italy | 5% |
Source: World Integrated Trade Solution
Global Finance Rankings & Awards

Data Sources:
UN World Population Prospects
World Inequality Report
S&P Global Ratings
Moody’s
Fitch Ratings
IMF Direction of Trade Statistics (DOTS)
UN Conference on Trade and Development (UNCTAD)
CIA The World Factbook
World Bank’s World Integrated Trade Solution
Forbes Global 2000