
Includes historical data for Uzbekistan’s Gross Domestic Product growth, debt-to-GDP ratio and more, as well as information on trade, banking and financial sector leadership.
Poverty Amid Mineral And Energy Wealth
Strategically positioned in Central Asia, Uzbekistan has recently embarked on a comprehensive reform program aimed at modernizing its previously closed and centralized economy. The government has set ambitious targets, including doubling the country’s GDP over the course of the current decade and addressing underemployment and poverty through improved business conditions.
Uzbekistan benefits from vast natural resources, low public debt, and significant foreign exchange reserves. Negotiations to join the World Trade Organization are underway, and foreign investment is welcomed across sectors. Despite such strengths and progress, weaknesses persist, notably trade dependence on Russia and China, opaque regulations, as well as vulnerability to commodity fluctuations, high unemployment, and elevated rates of informal economy.
Macroeconomy & Sovereign Data
| Type of Government | Presidential republic; highly authoritarian |
|---|---|
| Capital | Tashkent (Toshkent) |
| Sovereign Ratings |
S&P: B– Moody’s: Ba3 Fitch: B– |
| Total Population | 6.4 million |
| Median Age | 27 |
| Adult Per Capita Income (PPP) | 12,685.12 |
| Total GDP (2023) | 99.6 billion |
Uzbekistan GDP & Economic Overview
Most Recent Content
Uzbekistan
Economics, Policy & Regulation
Uzbekistan Minister Laziz Kudratov On Country’s Sweeping Economic Makeover
Economics, Policy & Regulation
Central Banker Report Cards 2024: Asia-Pacific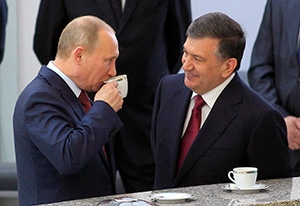
Emerging & Frontier Markets
Uzbekistan: New Iron Man Takes The HelmCapital Raising & Corporate Finance
ANNUAL SURVEY: WORLD’S BEST BANKS 2014Banking & Finance
Trade & Investment
| Total Exports | USD 31.3 billion (2022) |
|---|---|
| Leading Exports |
Gold Natural Gas Cotton Fibers Copper Ethylene Polymers |
| Total Imports | USD 14.4 billion (2022) |
| Leading Imports |
Cars And Vehicle Parts Packaged Medicines Refined Petroleum Aircraft Construction Vehicles |
| Source: | IMF, CIA The World Factbook |
Uzbekistan Leading Companies
| National Bank of Uzbekistan | Financials |
|---|---|
| Uztransgaz | Energy, Oil & Gas Exploration & Production |
| Almalyk Mining and Metallurgical Complex | Materials, Metals & Mining |
| Navoi Mining and Metallurgical Combinat | Materials, Metals & Mining |
| Uzbekistan Airways | Transportation, Airlines |
| Uztelecom | Telecommunication Services |
Major Trade Partners — Import
| Russia | 22.4% |
|---|---|
| China | 20.4% |
| Kazakhstan | 11.4% |
| South Korea | 7.3% |
| Türkiye | 7.0% |
Major Trade Partners — Export
| Unspecified | 33.0% |
|---|---|
| China | 12.4% |
| Russia | 12.1% |
| Türkiye | 11.6% |
| Kazakhstan | 7.3% |
Global Finance Rankings & Awards


Data Sources:
UN World Population Prospects
World Inequality Report
S&P Global Ratings
Moody’s
Fitch Ratings
IMF Direction of Trade Statistics (DOTS)
UN Conference on Trade and Development (UNCTAD)
CIA The World Factbook
World Bank’s World Integrated Trade Solution
Forbes Global 2000