
Dare To Be Great
Emerging-market economies are mainstays of global growth, with solid prospects for continuing to raise their citizens’ quality of life.
Whether it is true that every great challenge offers great opportunity, emerging markets were certainly handed plenty of both over the past several months. Between global trade tensions and homegrown problems, 2018 proved to be an especially transformative year for many economies. Currency concerns, declining commodity prices and dwindling investor confidence only added to the turbulence.
Hardships, however, helped bring out the peculiar—often unsung—strengths of these nations, proving once again that developing markets are not all created equal. Near-term constraints and negative sentiment about stock markets have, in many cases, obscured their solid macroeconomic fundamentals and longer-term prospects. The road to prosperity isn’t a straight line, and emerging markets remain poised for a continued expansion that will generate much of the world’s growth in the years ahead.
Owing to increasing affluence in emerging countries, mostly in Asia, the Brookings Institution says that 2018 also marked a global tipping point: For the first time in human history, the majority of the world (about 3.8 billion people) can now be considered “middle class”—that is, spending at least $11 per person, per day, in 2011 purchasing power parity. By 2025, developing-economy consumption is expected to reach $30 trillion annually—about half of the global total—up from $12 trillion in 2010.
Asia is leading the way. One unintended consequence of the US-China dispute was a diversion of trade and manufacturing investment to ASEAN economies—with Vietnam, Thailand, Cambodia, Indonesia and Malaysia standing to benefit the most as multinational corporations rethink their supply chains. China tried to weather the worst of the storm by carrying out economic reforms likely to power growth and competitiveness for years to come. India’s economy, pressured by a decline in the rupee and exports, is now forecast to pick up in 2019 and remains one of the fastest-growing nations in the world.
In the meantime, most of Latin America continued on its road to recovery, helped by high growth rates in Peru, Chile, Colombia and Paraguay and by the relative easing of political uncertainty in Brazil and Mexico. Emerging and developing Europe, although impacted by the currency crisis in Turkey and an overall economic deceleration in the eurozone, was buoyed by the vigorous performance of Central and Eastern nations.
The IMF expects growth in the Middle East and North Africa, constrained in part by weak oil output and geopolitical tensions, to nevertheless reach 2.4% GDP growth in 2019 before recovering to about 3% in 2020. A deterioration in business conditions in South Africa showed how its neighboring nations have become more insulated from risks of contagion: This year, one-third of sub-Saharan economies will post growth above 5%, claiming the title of world’s secondfastest growing region in the period leading to 2020.
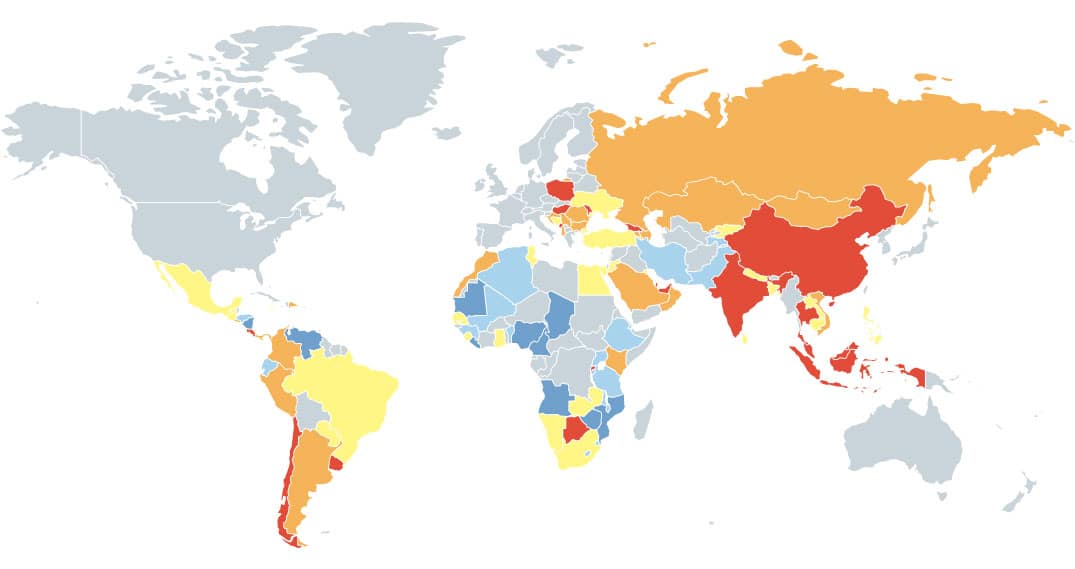
Global Finance’s country-by-country ranking highlights the most dynamic investment destinations based on their economic stability, quality of governance and business regulations. Our color-coded map divides these countries into five groups according to their overall attractiveness. In addition, we include a wealth of supporting data—and succinct pros and cons—for each emerging market expected to excel in 2019.
| Country | GDP Growth Forecast 2019 (%) | % Change in FDI 2016-2017 | Competitiveness Score 2018-2019 | Corruption Perceptions Score 2018 | Ease of Doing Business Rank 2019 |
|---|---|---|---|---|---|
| Europe | |||||
| Albania | 3.72 | 2 | 58.1 | 36 | 63 |
| Bosnia and Herzegovina | 3.5 | 40 | 54.2 | 38 | 89 |
| Bulgaria | 3.1 | -10 | 63.6 | 42 | 59 |
| Croatia | 2.6 | 20 | 60.1 | 48 | 58 |
| Georgia | 4.78 | 16 | 60.9 | 58 | 6 |
| Hungary | 3.3 | 143 | 64.3 | 46 | 53 |
| Moldova | 3.8 | 154 | 55.5 | 33 | 47 |
| Montenegro | 2.51 | 141 | 59.6 | 45 | 50 |
| Poland | 3.51 | -54 | 68.2 | 60 | 33 |
| Romania | 3.43 | 3 | 63.5 | 47 | 52 |
| Russia | 1.8 | -32 | 65.6 | 28 | 31 |
| Serbia | 3.5 | 22 | 60.9 | 39 | 48 |
| Turkey | 0.37 | -16 | 61.6 | 41 | 43 |
| Ukraine | 2.74 | -33 | 57.0 | 32 | 71 |
| Latin America | |||||
| Argentina | -1.62 | 264 | 57.5 | 40 | 119 |
| Brazil | 2.37 | 8 | 59.5 | 35 | 109 |
| Chile | 3.41 | -40 | 70.3 | 67 | 56 |
| Colombia | 3.59 | 5 | 61.6 | 36 | 65 |
| Costa Rica | 3.3 | 18 | 62.1 | 56 | 67 |
| Dominican Republic | 4.98 | 48 | 57.4 | 30 | 102 |
| Ecuador | 0.73 | -20 | 55.8 | 34 | 123 |
| El Salvador | 2.3 | 128 | 52.8 | 35 | 85 |
| Guatemala | 3.43 | -3 | 53.4 | 27 | 98 |
| Haiti | 2.5 | 257 | 36.5 | 20 | 182 |
| Honduras | 3.6 | 4 | 52.5 | 29 | 121 |
| Jamaica | 1.48 | -4 | 57.9 | 44 | 75 |
| Mexico | 2.52 | 0 | 64.6 | 28 | 54 |
| Nicaragua | -1 | 0 | 51.5 | 25 | 132 |
| Panama | 6.8 | 2 | 61.0 | 37 | 79 |
| Paraguay | 4.16 | 11 | 53.4 | 29 | 113 |
| Peru | 4.12 | -1 | 61.3 | 35 | 68 |
| Uruguay | 3.2 | 83 | 62.7 | 70 | 95 |
| Venezuela | -5 | -106 | 43.2 | 18 | 188 |
| Asia-Pacific | |||||
| Armenia | 4.8 | -27 | 59.9 | 35 | 41 |
| Azerbaijan | 3.62 | -36 | 60.0 | 25 | 25 |
| Bangladesh | 7.1 | -8 | 52.1 | 26 | 176 |
| Brunei | 5.06 | 69 | 61.4 | 63 | 55 |
| Cambodia | 6.78 | 12 | 50.2 | 20 | 138 |
| China | 6.18 | 2 | 72.6 | 39 | 46 |
| India | 7.44 | -10 | 62.0 | 41 | 77 |
| Indonesia | 5.12 | 488 | 64.9 | 38 | 73 |
| Kazakhstan | 3.13 | -43 | 61.8 | 31 | 28 |
| Kyrgyzstan | 4.53 | -85 | 53.0 | 29 | 70 |
| Lao PDR | 7.01 | -18 | 49.3 | 29 | 154 |
| Malaysia | 4.6 | -16 | 74.4 | 47 | 15 |
| Mongolia | 6.3 | 136 | 52.7 | 37 | 74 |
| Nepal | 5.04 | 87 | 50.8 | 31 | 110 |
| Pakistan | 4.01 | 13 | 51.1 | 33 | 136 |
| Philippines | 6.63 | 38 | 62.1 | 36 | 124 |
| Sri Lanka | 4.3 | 53 | 56.0 | 38 | 100 |
| Tajikistan | 5 | -36 | 52.2 | 25 | 126 |
| Thailand | 3.86 | 269 | 67.5 | 36 | 27 |
| Vietnam | 6.5 | 12 | 58.1 | 33 | 69 |
| Middle East | |||||
| Bahrain | 2.59 | 113 | 63.6 | 36 | 62 |
| Iran | -3.61 | 49 | 54.9 | 28 | 128 |
| Jordan | 2.5 | 7 | 59.3 | 49 | 104 |
| Kuwait | 4.06 | -28 | 62.1 | 41 | 97 |
| Lebanon | 1.4 | 1 | 57.7 | 28 | 142 |
| Oman | 5.05 | 11 | 64.4 | 52 | 78 |
| Qatar | 2.82 | 27 | 71.0 | 62 | 83 |
| Saudi Arabia | 2.43 | -81 | 67.5 | 49 | 92 |
| United Arab Emirates | 3.66 | 8 | 73.4 | 70 | 11 |
| Africa | |||||
| Algeria | 2.71 | -26 | 53.8 | 35 | 157 |
| Angola | 3.05 | -155 | 37.1 | 19 | 173 |
| Benin | 6.34 | 40 | 44.4 | 40 | 153 |
| Botswana | 3.61 | 210 | 54.5 | 61 | 86 |
| Burundi | 0.42 | 470 | 37.5 | 17 | 168 |
| Cameroon | 4.4 | 1 | 45.1 | 25 | 166 |
| Chad | 3.6 | 37 | 35.5 | 19 | 181 |
| Egypt | 5.46 | -9 | 53.6 | 35 | 120 |
| Ethiopia | 8.49 | -10 | 44.5 | 34 | 159 |
| Gambia | 5.4 | 416 | 45.5 | 37 | 149 |
| Ghana | 7.6 | -7 | 51.3 | 41 | 114 |
| Guinea | 5.93 | -64 | 43.2 | 28 | 152 |
| Kenya | 6.13 | 71 | 53.7 | 27 | 61 |
| Lesotho | 1.22 | 2 | 42.3 | 41 | 106 |
| Liberia | 4.51 | -45 | 40.5 | 32 | 174 |
| Malawi | 4.7 | -15 | 42.4 | 32 | 111 |
| Mali | 4.83 | -25 | 43.6 | 32 | 145 |
| Mauritania | 5.24 | 22 | 40.8 | 27 | 148 |
| Mauritius | 4.01 | -16 | 63.7 | 51 | 20 |
| Morocco | 3.17 | 23 | 58.5 | 43 | 60 |
| Mozambique | 4 | -26 | 39.8 | 23 | 135 |
| Namibia | 3.08 | 15 | 52.7 | 53 | 107 |
| Nigeria | 2.26 | -21 | 47.5 | 27 | 146 |
| Rwanda | 7.8 | 7 | 50.9 | 56 | 29 |
| Senegal | 6.72 | 13 | 49.0 | 45 | 141 |
| Sierra Leone | 5.55 | 306 | 38.8 | 30 | 163 |
| South Africa | 1.4 | -41 | 60.8 | 43 | 82 |
| Swaziland | 0.44 | -748 | 45.3 | 38 | 117 |
| Tanzania | 6.6 | -14 | 47.2 | 36 | 144 |
| Tunisia | 2.9 | -1 | 55.6 | 43 | 80 |
| Uganda | 6.11 | 12 | 46.8 | 26 | 127 |
| Zambia | 4.48 | 65 | 46.1 | 35 | 87 |
| Zimbabwe | 4.2 | -22 | 42.6 | 22 | 155 |
Sources:
IMF, World Economic Outlook (WEO), October 2018
UNCTAD, World Investment Report, June 2018
WORLD ECONOMIC FORUM, Global Competitiveness Report, 2018
TRANSPARENCY INTERNATIONAL, Corruption Perceptions Index, 2018
WORLD BANK, Doing Business Report, 2019.
Top 10 Performers for Each Economic Metric
| GDP Growth Forecast 2019 (%) | |
| Ethiopia | 8.49 |
| Rwanda | 7.80 |
| Ghana | 7.60 |
| India | 7.44 |
| Bangladesh | 7.10 |
| Lao PDR | 7.01 |
| Panama | 6.80 |
| Cambodia | 6.78 |
| Senegal | 6.72 |
| Philippines | 6.63 |
| % Change in FDI 2016-2017 | |
| Indonesia | 488 |
| Burundi | 470 |
| Gambia | 416 |
| Sierra Leone | 306 |
| Thailand | 269 |
| Argentina | 264 |
| Haiti | 257 |
| Botswana | 210 |
| Brunei | 181 |
| Moldova | 154 |
| Competitiveness Score 2018-2019 | |
| Malaysia | 74.4 |
| United Arab Emirates | 73.4 |
| China | 72.6 |
| Qatar | 71.0 |
| Chile | 70.3 |
| Poland | 68.2 |
| Saudi Arabia | 67.5 |
| Thailand | 67.5 |
| Russia | 65.6 |
| Indonesia | 64.9 |
| Corruption Perceptions Score 2018 | |
| United Arab Emirates | 70 |
| Uruguay | 70 |
| Chile | 67 |
| Brunei | 63 |
| Qatar | 62 |
| Botswana | 61 |
| Poland | 60 |
| Georgia | 58 |
| Costa Rica | 56 |
| Rwanda | 56 |
| Ease of Doing Business Rank 2019 | |
| Georgia | 6 |
| United Arab Emirates | 11 |
| Malaysia | 15 |
| Mauritius | 20 |
| Azerbaijan | 25 |
| Thailand | 27 |
| Kazakhstan | 28 |
| Rwanda | 29 |
| Russia | 31 |
| Poland | 33 |