Early Morning in Emerging Markets
Despite the pandemic setback, it is emerging economies that hold the greatest promise for new growth.
Just a few months ago, the IMF was forecasting positive per capita income growth in 2020 for over 160 of its member countries. Now the expectation is that more than 170 will have negative per capita income growth, with low-income nations particularly at risk.
|
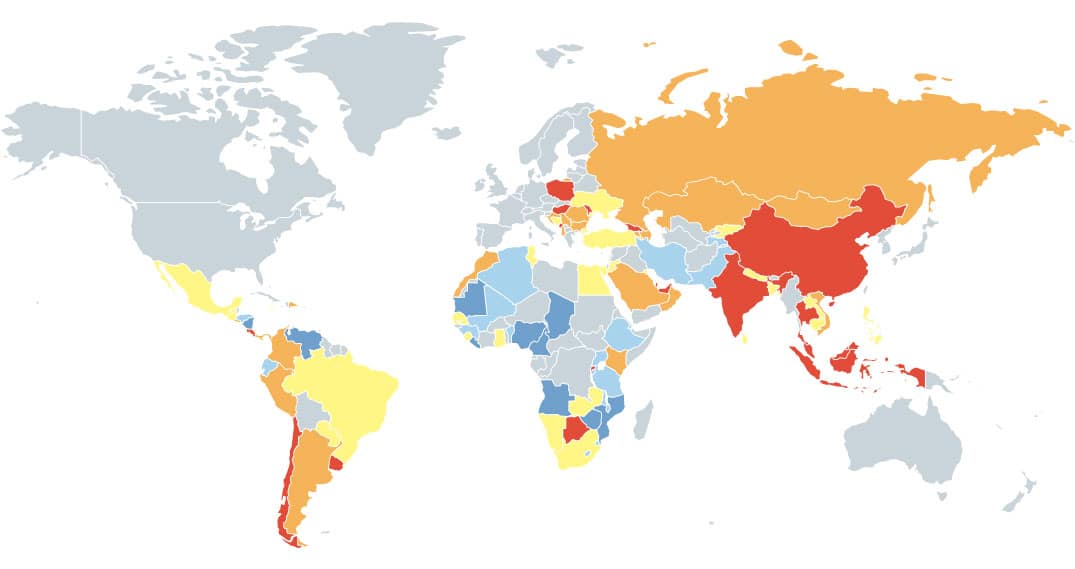
Global Finance’s country-by-country ranking highlights the most dynamic investment destinations, based on their economic stability, quality of governance and business regulations. Our color-coded map divides these countries into five groups according to their overall attractiveness. In addition, we include a wealth of supporting data—and succinct pros and cons—for each emerging market expected to perform better in 2020. |
It might seem almost unfitting to celebrate the strength and the many achievements of the world’s emerging nations in the midst of one of the worst crises in modern history. In retrospect, the trade clashes and global geopolitical tensions that have been the hallmark of the past year seem almost trivial in comparison to the frightening pandemic brought about by the spread of the Covid-19 coronavirus. However, experts now agree that those disputes—along with the deterioration of trust—left us weakened and unable to mount a coordinated response. If anything, we have been reminded of how much we depend on each other.
Yet, it would be also inaccurate to look back and look ahead and see only adversities in lieu of the determination and resilience these enormous challenges have brought to light. Despite all the trials and hardships, emerging markets have never stopped on their path to sustainable development and prosperity. Faced with one threat after another, they have often intervened more promptly and resolutely than their most developed counterparts to protect their hard-won gains. These efforts have not gone to waste. In the most optimistic view, the recession will be short-lived, and after this painful pause we will hit the start button again. Others reject this interpretation and maintain that the recovery will take years. In either case, today most developing countries are stronger, richer and more competitive than they have ever been in modern times—and better positioned to withstand and bounce back from a crisis of this magnitude.
Long-term prospects for the emerging markets have not changed. Home to more than 80% of the world’s working-age citizens, developing economies became the main driver of global growth at the beginning of the past decade. While their level of productivity will be impacted for the near future, their economic foundations will stand. Population growth, mass urbanization and rising disposable incomes—all sustained trends that overcome temporary setbacks—will propel these countries increasingly to the forefront of the economic and political stage. By 2050 up to six of what are currently known as emerging nations could be among the seven largest economies in the world, according to projections by PwC and others. Long before then, the G7 will have started bearing little or no resemblance to its current composition. The pace of change will be dizzying; and as other small and big crises will inevitably arise and continue to highlight vulnerabilities, vulnerabilities will continue to promote change. It is always darkest before dawn
| Country | GDP Growth Forecast 2020 (%) | % Change in FDI 2017-2018 | Competitiveness Score 2019-2020 | Corruption Perceptions Score 2019 | Ease of Doing Business Rank 2020 |
|---|---|---|---|---|---|
| Europe | |||||
| Albania | -5.006 | 13 | 67.6 | 35 | 67.7 |
| Bosnia and Herzegovina | -5 | 4 | 54.7 | 36 | 65.4 |
| Bulgaria | -4 | -21 | 64.9 | 43 | 72.0 |
| Croatia | -9.024 | -43 | 61.9 | 47 | 73.6 |
| Georgia | -3.999 | -35 | 60.6 | 56 | 63.7 |
| Hungary | -3.1 | 96 | 65.1 | 44 | 73.4 |
| Moldova | -3 | 39 | 56.7 | 32 | 74.4 |
| Montenegro | -8.976 | -12 | 60.8 | 45 | 73.8 |
| Poland | -4.579 | 25 | 68.9 | 58 | 76.4 |
| Romania | -5 | 9 | 64.4 | 44 | 73.3 |
| Russia | -5.466 | -49 | 66.7 | 28 | 78.2 |
| Serbia | -3.016 | 44 | 60.9 | 39 | 75.7 |
| Turkey | -4.998 | 13 | 62.1 | 39 | 76.8 |
| Ukraine | -7.731 | -9 | 57.0 | 30 | 70.2 |
| Latin America | |||||
| Argentina | -5.719 | 6 | 57.2 | 45 | 59 |
| Brazil | -5.303 | -9 | 60.9 | 35 | 59.1 |
| Chile | -4.486 | 4 | 70.5 | 67 | 72.6 |
| Colombia | -2.386 | -20 | 62.7 | 37 | 70.1 |
| Costa Rica | -3.292 | -22 | 62.0 | 56 | 69.2 |
| Dominican Republic | -0.965 | -29 | 58.3 | 28 | 60 |
| Ecuador | -6.271 | 127 | 55.7 | 38 | 57.7 |
| El Salvador | 5.44 | -6 | 52.6 | 34 | 65.3 |
| Guatemala | -1.963 | 4 | 53.5 | 26 | 56.3 |
| Haiti | -4 | -72 | 36.3 | 18 | 40.7 |
| Honduras | -2.35 | 3 | 52.7 | 26 | 56.3 |
| Jamaica | -5.605 | -13 | 58.3 | 43 | 69.7 |
| Mexico | -6.63 | -2 | 64.9 | 29 | 72.4 |
| Nicaragua | -6 | -53 | 51.5 | 22 | 54.4 |
| Panama | -2.05 | 21 | 61.6 | 36 | 66.6 |
| Paraguay | -1 | 0 | 53.6 | 28 | 59.1 |
| Peru | -4.534 | -9 | 61.7 | 36 | 68.7 |
| Uruguay | -3 | 31 | 63.5 | 71 | 61.5 |
| Venezuela | -15 | 15.06 | 41.8 | 16 | 30.2 |
| Asia-Pacific | |||||
| Armenia | -1.479 | 2 | 61.3 | 42 | 74.5 |
| Azerbaijan | -2.184 | -51 | 62.7 | 30 | 76.7 |
| Bangladesh | 2.019 | 68 | 52.1 | 26 | 45 |
| Brunei | 1.297 | 10 | 62.8 | 60 | 70.1 |
| Cambodia | -1.587 | 11 | 52.1 | 20 | 53.8 |
| China | 1.181 | 4 | 73.9 | 41 | 77.9 |
| India | 1.871 | 6 | 61.4 | 41 | 71 |
| Indonesia | 0.499 | 7 | 64.6 | 40 | 69.6 |
| Kazakhstan | -2.53 | -18 | 62.9 | 34 | 79.6 |
| Kyrgyzstan | -4.044 | 144 | 54 | 30 | 67.8 |
| Lao PDR | 0.723 | -17 | 50.1 | 29 | 50.8 |
| Malaysia | -1.7 | -14 | 74.6 | 53 | 81.5 |
| Mongolia | -1 | 45 | 52.6 | 35 | 67.8 |
| Nepal | 2.509 | 24 | 51.6 | 34 | 63.2 |
| Pakistan | -1.547 | -27 | 51.4 | 32 | 61 |
| Philippines | 0.648 | -26 | 61.9 | 34 | 62.8 |
| Sri Lanka | -0.536 | 17 | 57.1 | 38 | 61.8 |
| Tajikistan | 1 | 17 | 52.4 | 25 | 61.3 |
| Thailand | -6.662 | 62 | 68.1 | 36 | 80.1 |
| Vietnam | 2.7 | 10 | 61.5 | 37 | 69.8 |
| Middle East | |||||
| Bahrain | -3.59 | 6 | 65.4 | 42 | 76 |
| Iran | -5.985 | -31 | 53 | 26 | 58.5 |
| Jordan | -3.735 | -53 | 60.9 | 48 | 69 |
| Kuwait | -1.108 | -1 | 65.1 | 40 | 67.4 |
| Lebanon | -12.019 | 14 | 56.3 | 28 | 54.3 |
| Oman | -2.844 | 44 | 63.6 | 52 | 70 |
| Qatar | -4.345 | -322 | 72.9 | 62 | 68.7 |
| Saudi Arabia | -2.283 | 126 | 70 | 53 | 71.6 |
| United Arab Emirates | -3.492 | 0 | 75 | 71 | 80.9 |
| Africa | |||||
| Algeria | -5.157 | 22 | 56.3 | 35 | 48.6 |
| Angola | -1.374 | 23 | 38.1 | 26 | 41.3 |
| Benin | 4.519 | 4 | 45.8 | 41 | 52.4 |
| Botswana | -5.379 | 29 | 55.5 | 61 | 66.2 |
| Burundi | 5.542 | 211 | 40.3 | 19 | 46.8 |
| Cameroon | -1.215 | -14 | 46.0 | 25 | 46.1 |
| Chad | -0.158 | 98 | 35.1 | 25 | 36.9 |
| Egypt | 1.952 | -8 | 54.5 | 18 | 60.1 |
| Ethiopia | 3.237 | -18 | 44.4 | 37 | 48 |
| Gambia | 2.5 | 64 | 45.9 | 37 | 50.3 |
| Ghana | 7.6 | -7 | 51.3 | 41 | 114 |
| Guinea | 2.92 | -16 | 46.1 | 29 | 494 |
| Kenya | 1.01 | 27 | 54.1 | 18 | 73.2 |
| Lesotho | -5.208 | -9 | 42.9 | 40 | 49.4 |
| Liberia | -2.501 | -51 | 40.5 | 28 | 43.2 |
| Malawi | 1 | 13 | 43.7 | 31 | 60.9 |
| Mali | 1.532 | -35 | 43.6 | 29 | 52.9 |
| Mauritania | -1.986 | -88 | 40.9 | 28 | 51.1 |
| Mauritius | -6.8 | -16 | 64.3 | 52 | 81.5 |
| Morocco | -3.74 | 36 | 60.0 | 41 | 73.4 |
| Mozambique | 2.2 | 18 | 38.1 | 26 | 55 |
| Namibia | -2.484 | -58 | 54.5 | 52 | 61.4 |
| Nigeria | -3.41 | -43 | 48.3 | 32 | 56.9 |
| Rwanda | 3.5 | 12 | 52.8 | 53 | 76.5 |
| Senegal | 2.992 | 7 | 49.7 | 45 | 59.3 |
| Sierra Leone | -2.314 | 365 | 38.8 | 33 | 47.5 |
| South Africa | -5.801 | 166 | 62.4 | 33 | 67 |
| Swaziland (Eswatini) | -0.941 | 1454100 | 46.4 | 16 | 59.5 |
| Tanzania | 2.013 | 18 | 48.2 | 37 | 54.5 |
| Tunisia | -4.276 | 18 | 56.4 | 43 | 68.7 |
| Uganda | 3.52 | 67 | 48.9 | 28 | 60 |
| Zambia | -3.507 | -49 | 46.5 | 34 | 66.9 |
| Zimbabwe | -7.383 | 113 | 44.2 | 24 | 54.5 |
Sources:
IMF, World Economic Outlook (WEO), April 2020
UNCTAD, World Investment Report, June 2019
WORLD ECONOMIC FORUM, Global Competitiveness Report, 2019 (for all countries) and 2018 (for Liberia and Sierra Leone)
TRANSPARENCY INTERNATIONAL, Corruption Perceptions Index, 2019
WORLD BANK, Doing Business Report, 2020
Top 10 Performers for Each Economic Metric
| GDP Growth Forecast 2020 (%) | |
| Benin | 4.52 |
| Uganda | 3.52 |
| Rwanda | 3.50 |
| Ethiopia | 3.24 |
| Senegal | 2.99 |
| Guinea | 2.92 |
| Vietnam | 2.70 |
| Nepal | 2.51 |
| Gambia | 2.50 |
| Mozambique | 2.20 |
| % Change in FDI 2017-2018 | |
| Venezuela | 1505.90 |
| Sierra Leone | 364.76 |
| Burundi | 210.85 |
| South Africa | 165.79 |
| Swaziland (Eswatini) | 145.41 |
| Kyrgyzstan | 143.84 |
| Ecuador | 126.54 |
| Saudi Arabia | 126.13 |
| Zimbabwe | 113.11 |
| Chad | 97.68 |
| Competitiveness Score 2019-2020 | |
| United Arab Emirates | 75.0 |
| Malaysia | 74.6 |
| China | 73.9 |
| Qatar | 72.9 |
| Chile | 70.5 |
| Saudi Arabia | 70.0 |
| Poland | 68.9 |
| Thailand | 68.1 |
| Russia | 66.7 |
| Britain | 65.4 |
| Corruption Perceptions Score 2019 | |
| Uruguay | 71 |
| United Arab Emirates | 71 |
| Chile | 67 |
| Qatar | 62 |
| Botswana | 61 |
| Brunei | 60 |
| Poland | 58 |
| Georgia | 56 |
| Costa Rica | 56 |
| Malaysia | 53 |
| Ease of Doing Business Rank 2020 | |
| Georgia | 83.7 |
| Malaysia | 81.5 |
| Mauritius | 81.5 |
| United Arab Emirates | 80.9 |
| Thailand | 80.1 |
| Kazakhstan | 76.9 |
| Russia | 78.2 |
| China | 77.9 |
| Turkey | 76.8 |
| Azerbaijan | 76.7 |