COVID-19 spread around the world and made existing inequalities worse.
Inequality kills.
That’s the title of a recent report published by Oxfam which found that during the first two years of the pandemic inequality contributed to the death of at least 21,000 people each day, or one person every four seconds. Over the course of those four seconds, the world’s 10 richest people were making roughly $60,000, or $1.3 billion a day. Overall, 160 million more people fell into poverty since the start of the global health emergency while the richest 10 billionaires more than doubled their wealth to an astounding $1.5 trillion.
By now you have probably realized that the odds of becoming one of the world’s top 10 billionaires are extremely low. However, the chances of entering the class of the top 10% income-earners are indubitably much higher, and in statistical terms any given individual is far more likely to belong to that section of the society that represents the bottom 50% of the adult world population, which collectively amounts to 2.5 billion people. Varying from country to country and due to a myriad of other factors, we might live a relatively comfortable life and consider ourselves lucky; yet on a more level playing field our slice of the economic pie would be much larger. In no country in the world but one (Czech Republic) does the bottom half of the population gets a share of national income larger than 25%, and such a figure can get much lower—as low as 5.48% (South Africa).
As strange as it might seem, global inequality impacts the rich too. Consultancy Knight Frank provides a striking example: It takes a net wealth (as in all the assets owned by a person) of almost $8 million to join the richest 1% of the tiny European principality of Monaco, $5.1 million if you are in Switzerland and $4.7 million in the United States, but only $60,000 if you live in India, Philippines or Indonesia, and merely $20,000 if you are in Kenya. One could argue that every rich person is equal, but some are more equal than others.
National income is the sum of all incomes received by individuals residents in a given country over a year. Incomes takes various forms and we typically distinguish two broad sources: incomes stemming from individuals’ labor (e.g. wages or salaries) and incomes stemming from individuals’ wealth (e.g. interest and dividends).
Source: World Inequality Report 2022
Yet, while the relative fortunes of the most affluent individuals in virtually all nations have been growing in recent years, and often for decades, everyone else has become poorer: Covid has deepened this trend, cutting the incomes of 99% of the global population. The pandemic piled up over the usual culprits of inequality (lopsided tax policies and fiscal evasion, racial and gender discrimination and of all kinds, technology gaps, climate change, conflict and all the sad legacies of colonialism) and pushed down further those who were already struggling to stay afloat.
Families across the globe are bogged down by debt due to healthcare expenses and the loss of productivity triggered by the pandemic—not to mention the past, the present and the future damage caused by the uneven distribution of the vaccine. The digital divide penalized not only many workers, but countless children unable to access remote learning during school closures: They might not be the breadwinners of their families today, but their future prospects and earnings are likely to be affected tomorrow, perpetuating cycles of poverty and low social mobility. And while inflation surged globally, there is such a thing as inflation inequality too: lower-income families spend a higher percentage of their budget on groceries and energy for their homes and transportation, basic necessities whose prices are more volatile and tend to increase the most. It is expensive to be poor.
Yet, inequality does not have to be an inevitability. Take the example of the United States. The widely-held assumption that inequality is the price to pay for rapid economic growth, and that over time the rising tide of abundance will lift all boats, still has many advocates. US President Ronald Reagan, more than anyone else, contributed to popularizing the concept of trickle-down economics. However, according to the Economic Policy Institute, between 1979 and 2019 wages for the richest 1% in the U.S. have soared 160%, while the share of wages for the bottom 90% has shrunk by about 9 percentage points. While the wealthy let their money make more money through investments and business ventures, the majority of Americans earn their living through salaries and wages—yet, taxes on salaries and wages are significantly higher than taxes on investments.
It is clear by now that how rich or poor a country is tells us nothing about how equal or unequal the rich and poor are within a given country. National averages and other single-number metrics such as the Gini coefficient, the most commonly used measure of income inequality, provide no indication of how income and wealth are distributed across the population, or who gains and who loses over time as a result of the adoption of different economic policies.
In December, the World Inequality Lab—a research center based at the Paris School of Economics—released the 2022 World Inequality Report (WIR), which presents analyses generated by more than 100 researchers from all continents over the course of the past four years. The poorest 50% of the global population—the researchers at the Lab assessed—currently earns just 8.5% of global income, generating a median income of $3,920 per year; by contrast, the richest 10% of the population currently takes 52% of global income, or $122,100 per individual each year.
These numbers conceal wide disparities both between and within countries and across regions. The top 10% of the population of the Middle East and Northern Africa, the two most unequal regions in the world, capture roughly 58% of the total national income; in Sub-Saharan Africa, that share amounts to 56% and in Latin America and South and South East Asia to 55%. Looking at nations individually, the richest top 10% earns more than 60% of the total income in six African countries, but less than 30% in several Slavic and Nordic countries, with other members of the European bloc not far behind percentage-wise.
Even taking into account intra-regional differences, the fact that Europe remains the most equal of all regions, with the top 10% receiving 36% of the national income, is not serendipity but the result—the report explains—of public investments in job creation, education and health financed through redistribution mechanisms in the tax system.
While fiscal matters can be fuzzy, the Inequality Lab offers a clear example of what such mechanisms can achieve. In 2020 alone, the report says, global billionaires’ wealth increased by more about $4 trillion: had a global tax been applied on such excess wealth, today these global billionaires’ would still be as rich as they were before the pandemic, yet the global healthcare spending for an entire year could have been almost doubled. Such a missed opportunity at such a crucial time—then again, wealth does not automatically trickle down.
|
Inequality Ranking |
Country |
Bottom 50% |
Top 10% |
Top 1% |
| 1 | South Africa | 5.48 | 66.23 | 22.0 |
| 2 | Namibia | 6.55 | 64.2 | 21.57 |
| 3 | Zambia | 6.95 | 61.74 | 23.17 |
| 4 | Central African Republic | 7.63 | 64.91 | 31.00 |
| 5 | Eswatini | 7.86 | 59.88 | 19.33 |
| 6 | Botswana | 8.12 | 59.26 | 22.74 |
| 7 | Mozambique | 8.30 | 64.63 | 31.11 |
| 8 | Oman | 8.77 | 56.21 | 19.57 |
| 9 | Qatar | 9.02 | 56.79 | 23.61 |
| 10 | Angola | 9.04 | 56.79 | 23.61 |
| 11 | Yemen | 9.15 | 59.50 | 24.71 |
| 12 | Mexico | 9.17 | 57.35 | 24.71 |
| 13 | Zimbabwe | 9.23 | 58.95 | 21.08 |
| 14 | Guinea-Bissau | 9.59 | 60.13 | 17.08 |
| 15 | Congo | 9.92 | 55.93 | 20.52 |
| 16 | Bahrain | 9.96 | 57.66 | 25.07 |
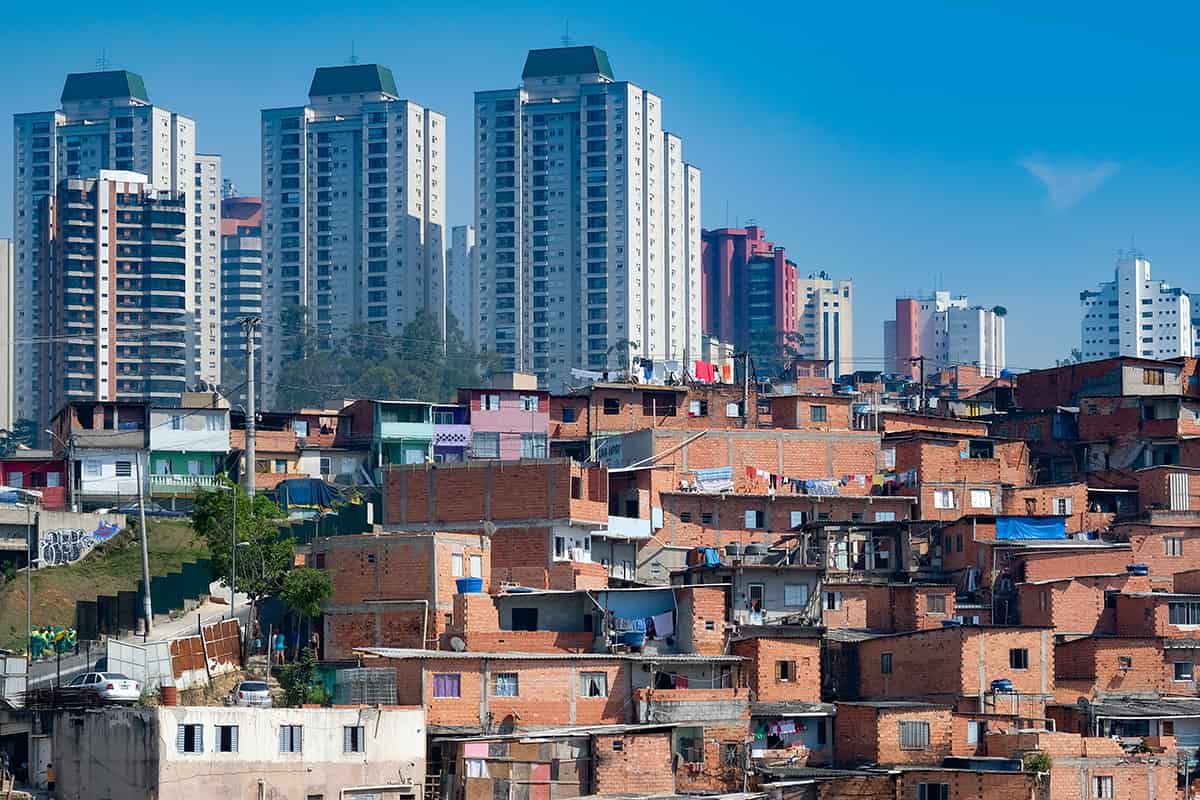
| 17 | Brazil | 10.07 | 58.56 | 26.60 |
| 18 | Chile | 10.18 | 58.91 | 26.47 |
| 19 | Cameroon | 10.63 | 52.05 | 15.85 |
| 20 | Colombia | 10.63 | 51.46 | 18.85 |
| 21 | Costa Rica | 10.72 | 50.10 | 19.29 |
| 22 | Saudi Arabia | 10.80 | 54.41 | 20.98 |
| 23 | Peru | 11.22 | 49.94 | 20.11 |
| 24 | Lesotho | 11.28 | 49.51 | 14.46 |
| 25 | Comoros | 11.39 | 50.26 | 14.15 |
| 26 | Benin | 11.42 | 54.75 | 17.51 |
| 27 | Equatorial Guinea | 11.45 | 51.63 | 17.59 |
| 28 | Cote d’Ivoire | 11.58 | 54.66 | 21.03 |
| 29 | Kuwait | 11.61 | 54.03 | 19.38 |
| 30 | El Salvador | 11.68 | 41.07 | 13.49 |
| 31 | Malawi | 11.79 | 56.45 | 28.04 |
| 32 | Rwanda | 11.84 | 53.94 | 19.89 |
| 33 | South Sudan | 11.91 | 50.01 | 15.53 |
| 34 | Turkey | 11.92 | 54.47 | 18.84 |
| 35 | Turkmenistan | 12.01 | 49.88 | 19.87 |
| 36 | Palestine | 12.03 | 51.41 | 17.93 |
| 37 | Uganda | 12.13 | 52.07 | 17.05 |
| 38 | Seychelles | 12.13 | 52.09 | 20.56 |
| 39 | Ghana | 12.21 | 48.91 | 15.23 |
| 40 | Togo | 12.22 | 47.98 | 13.85 |
| 41 | Chad | 12.30 | 49.30 | 15.71 |
| 42 | Cabo Verde | 12.38 | 49.08 | 13.91 |
| 43 | Indonesia | 12.39 | 48.00 | 18.28 |
| 44 | Madagascar | 12.48 | 50.76 | 15.17 |
| 45 | United Arab Emirates | 12.61 | 49.15 | 15.83 |
| 46 | Bahamas | 12.62 | 48.61 | 19.53 |
| 47 | Belize | 12.62 | 48.61 | 19.53 |
| 48 | Bolivia | 12.62 | 48.61 | 19.53 |
| 49 | Dominican Republic | 12.62 | 48.61 | 19.53 |
| 50 | Guatemala | 12.62 | 48.61 | 19.53 |
| 51 | Guyana | 12.62 | 48.61 | 19.53 |
| 52 | Haiti | 12.62 | 48.61 | 19.53 |
| 53 | Honduras | 12.62 | 48.61 | 19.53 |
| 54 | Jamaica | 12.62 | 48.61 | 19.53 |
| 55 | Nicaragua | 12.62 | 48.61 | 19.53 |
| 56 | Panama | 12.62 | 48.61 | 19.53 |
| 57 | Paraguay | 12.62 | 48.61 | 19.53 |
| 58 | Suriname | 12.62 | 48.61 | 19.53 |
| 59 | Trinidad and Tobago | 12.62 | 48.61 | 19.53 |
| 60 | Iraq | 12.62 | 52.23 | 20.72 |
| 61 | DR Congo | 12.64 | 48.84 | 14.63 |
| 62 | Lao PDR | 12.84 | 49.44 | 20.14 |
| 63 | Papua New Guinea | 12.85 | 46.99 | 16.66 |
| 64 | Tanzania | 12.95 | 51.37 | 18.15 |
| 65 | Zanzibar | 12.95 | 51.37 | 18.15 |
| 66 | Israel | 12.98 | 49.15 | 16.55 |
| 67 | Kenya | 13.01 | 48.72 | 15.19 |
| 68 | Djibouti | 13.09 | 49.55 | 15.86 |
| 69 | India | 13.13 | 57.13 | 18.15 |
| 70 | Iran | 13.25 | 52.71 | 18.20 |
| 71 | United States | 13.31 | 45.46 | 18.76 |
| 72 | Senegal | 13.38 | 47.71 | 13.18 |
| 73 | Morocco | 13.56 | 49.43 | 15.14 |
| 74 | Hong Kong | 13.59 | 48.18 | 17.85 |
| 75 | Cambodia | 13.86 | 46.50 | 18.56 |
| 76 | Thailand | 13.89 | 48.79 | 17.76 |
| 77 | Georgia | 13.90 | 49.03 | 21.11 |
| 78 | Burundi | 14.02 | 48.39 | 14.74 |
| 79 | Sri Lanka | 14.11 | 49.43 | 20.64 |
| 80 | Jordan | 14.13 | 49.57 | 17.51 |
| 81 | Philippines | 14.32 | 46.08 | 16.88 |
| 82 | China | 14.36 | 41.66 | 14.00 |
| 83 | Macao | 14.36 | 41.66 | 14.00 |
| 84 | Gabon | 14.42 | 43.32 | 11.02 |
| 85 | Vietnam | 14.58 | 46.26 | 16.92 |
| 86 | Uzbekistan | 14.58 | 46.26 | 11.02 |
| 87 | Egypt | 14.62 | 49.94 | 19.93 |
| 88 | Mauritius | 14.81 | 47.40 | 15.89 |
| 89 | Mongolia | 14.88 | 44.17 | 16.54 |
| 90 | Somalia | 14.94 | 44.06 | 12.44 |
| 91 | Sierra Leone | 14.99 | 47.00 | 15.02 |
| 92 | Bhutan | 15.01 | 42.59 | 14.17 |
| 93 | Gambia | 15.02 | 45.87 | 13.61 |
| 94 | Burkina Faso | 15.04 | 47.26 | 14.56 |
| 95 | Romania | 15.15 | 41.42 | 14.41 |
| 96 | Liberia | 15.43 | 43.24 | 12.20 |
| 97 | Tajikistan | 15.50 | 42.72 | 11.59 |
| 98 | Nigeria | 15.58 | 40.70 | 14.79 |
| 99 | Canada | 15.72 | 43.30 | 11.60 |
| 100 | Niger | 15.77 | 45.04 | 15.36 |
| 101 | Sudan | 15.84 | 45.47 | 13.82 |
| 102 | Eritrea | 15.84 | 45.47 | 13.82 |
| 103 | Ethiopia | 15.93 | 44.07 | 17.09 |
| 104 | Myanmar | 16.04 | 46.45 | 14.71 |
| 105 | Korea | 16.04 | 46.45 | 14.71 |
| 106 | Ecuador | 16.14 | 37.32 | 11.66 |
| 107 | Australia | 16.16 | 33.60 | 12.85 |
| 108 | Guinea | 16.19 | 42.69 | 12.53 |
| 109 | Mali | 16.34 | 41.26 | 9.69 |
| 110 | Libya | 16.34 | 44.20 | 13.56 |
| 111 | Kazakhstan | 16.36 | 42.53 | 15.40 |
| 112 | Montenegro | 16.48 | 35.90 | 9.69 |
| 113 | Bulgaria | 16.48 | 43.52 | 18.27 |
| 114 | Tunisia | 16.61 | 41.37 | 10.91 |
| 115 | Singapore | 16.65 | 46.28 | 14.21 |
| 116 | Nepal | 16.67 | 41.92 | 13.89 |
| 117 | Timor-Leste | 16.75 | 42.32 | 15.66 |
| 118 | Mauritania | 16.78 | 40.48 | 10.75 |
| 119 | Japan | 16.78 | 44.89 | 13.11 |
| 120 | Kyrgyzstan | 16.82 | 44.15 | 18.43 |
| 121 | Russian Federation | 16.98 | 46.43 | 21.45 |
| 122 | Bangladesh | 17.06 | 42.85 | 16.33 |
| 123 | Pakistan | 17.27 | 43.26 | 16.82 |
| 124 | Malaysia | 17.30 | 40.27 | 14.87 |
| 125 | Sao Tome and Principe | 17.50 | 39.38 | 8.95 |
| 126 | Serbia | 17.75 | 66.23 | 10.85 |
| 127 | Latvia | 17.91 | 34.52 | 9.13 |
| 128 | Lithuania | 18.06 | 36.57 | 10.95 |
| 129 | Maldives | 18.06 | 39.96 | 13.26 |
| 130 | Moldova | 18.19 | 34.39 | 9.81 |
| 131 | Estonia | 18.24 | 34.74 | 11.76 |
| 132 | Bosnia and Herzegovina | 18.27 | 34.07 | 8.88 |
| 133 | Uruguay | 18.30 | 40.13 | 14.95 |
| 134 | Croatia | 18.41 | 35.40 | 10.24 |
| 135 | Armenia | 18.54 | 40.62 | 15.39 |
| 136 | Albania | 18.91 | 34.00 | 8.91 |
| 137 | Germany | 18.99 | 37.07 | 12.77 |
| 138 | Algeria | 19.02 | 38.08 | 9.91 |
| 139 | Cyprus | 19.15 | 36.36 | 11.49 |
| 140 | Brunei Darussalam | 19.22 | 37.76 | 13.56 |
| 141 | Poland | 19.47 | 37.75 | 14.87 |
| 142 | New Zealand | 19.57 | 34.57 | 11.87 |
| 143 | Portugal | 20.04 | 35.21 | 9.59 |
| 144 | Luxembourg | 20.19 | 33.53 | 10.37 |
| 145 | Azerbaijan | 20.29 | 39.07 | 14.31 |
| 146 | United Kingdom | 20.35 | 35.67 | 12.65 |
| 147 | Belgium | 20.40 | 32.89 | 8.63 |
| 148 | Ireland | 20.44 | 35.18 | 11.80 |
| 149 | Malta | 20.50 | 32.52 | 9.14 |
| 150 | Italy | 20.70 | 32.21 | 8.71 |
| 151 | North Macedonia | 20.94 | 29.23 | 6.52 |
| 152 | Greece | 21.01 | 32.61 | 10.80 |
| 153 | Spain | 21.12 | 34.48 | 12.38 |
| 154 | Denmark | 21.38 | 33.86 | 12.91 |
| 155 | Taiwan | 21.38 | 33.99 | 14.51 |
| 156 | Finland | 21.51 | 33.84 | 10.88 |
| 157 | Hungary | 22.00 | 33.85 | 12.27 |
| 158 | Austria | 22.04 | 29.43 | 10.09 |
| 159 | Netherlands | 22.50 | 33.39 | 6.92 |
| 160 | Belarus | 22.51 | 33.49 | 9.86 |
| 161 | Ukraine | 22.57 | 32.49 | 9.48 |
| 162 | Switzerland | 22.63 | 32.23 | 11.46 |
| 163 | France | 22.72 | 32.23 | 9.84 |
| 164 | Slovenia | 23.07 | 29.58 | 8.02 |
| 165 | Sweden | 23.78 | 30,78 | 10.54 |
| 166 | Slovakia | 24.56 | 26.50 | 7.04 |
| 167 | Norway | 24.84 | 29.59 | 8.88 |
| 168 | Iceland | 24.98 | 29.09 | 8.78 |
| 169 | Czech Republic | 25.48 | 28.57 | 10.04 |
Source: World Inequality Database.