African Gems | Alexandria Container and Cargo tops Global Finance’s first annual ranking of the 25 Best-Performing Companies in Africa.
Back To Supplment
Methodology
The 25 Best-Performing Public Com-panies in Africa ranking evaluates nonfinancial companies on four measures: liquidity, solvency, return on assets and profit margin. The ranking begins with the top 300 companies by market capitalization.
Firms are given a score on each measure, and those figures are totaled to create an overall score. A low score on each measure is equated with best performance, and the company with the lowest overall score places highest in the ranking.
African Gems
Egyptian transportation company Alexandria Container and Cargo tops Global Finance’s first annual list of the 25 Best-Performing Public Companies in Africa. The firm scored well on all four of the criteria used to determine performance: liquidity, solvency, return on assets (ROA) and profit margin. It scored in the top 5 on all of these measures.
BEST-PERFORMING COMPANIES
Rank |
Company |
Country |
Sector |
Liq. Ratio |
Lev. Ratio |
Return On Assets |
Profit Margin (%) |
Total Score |
|---|---|---|---|---|---|---|---|---|
|
1 |
ALEXANDRIA CONTAINER |
EG |
Transport |
6.00 |
89.86 |
37.33 |
59.31 |
13 |
|
2 |
COMPAGNIE MINIERE DE TOUISSIT |
MA |
Metals & metal products |
4.27 |
81.11 |
20.24 |
49.35 |
46 |
|
3 |
TRUWORTHS INTERNATIONAL |
ZA |
Wholesale & |
4.35 |
82.24 |
29.79 |
31.39 |
51 |
|
4 |
SWISSPORT TANZANIA |
TZ |
Transport |
2.67 |
71.87 |
46.54 |
42.06 |
67 |
|
5 |
EGYPTIAN SATELLITE |
EG |
Post & telecom |
5.76 |
77.98 |
14.89 |
38.32 |
72 |
|
6 |
ASSORE |
ZA |
Metals & metal products |
2.37 |
92.06 |
21.13 |
25.26 |
73 |
|
7 |
SOCIETE METALLURGIQUE D’IMITER |
MA |
Metals & metal products |
5.74 |
87.99 |
13.59 |
31.20 |
74 |
|
8 |
SIDI KERIR PETROCHEMICALS |
EG |
Chemicals, rubber, plastics, non-metallic products |
1.75 |
68.29 |
25.31 |
47.77 |
102 |
|
8 |
ABU KIR FERTILIZERS & CHEMICAL INDUSTRIES |
EG |
Chemicals, rubber, plastics, non-metallic products |
2.06 |
65.46 |
27.79 |
41.38 |
102 |
|
10 |
ALEXANDRIA MINERAL OILS COMPANY |
EG |
Primary sector |
4.63 |
85.86 |
21.95 |
10.92 |
123 |
|
11 |
SOCIETE LES CIMENTS DU MAROC |
MA |
Chemicals, rubber, plastics, non-metallic products |
1.81 |
84.24 |
10.71 |
29.67 |
125 |
|
12 |
MISR CEMENT COMPANY – QENA |
EG |
Chemicals, rubber, plastics, non-metallic products |
1.50 |
63.94 |
27.58 |
39.09 |
132 |
|
13 |
METROFILE HOLDINGS |
ZA |
Other services |
1.51 |
70.09 |
19.11 |
30.35 |
133 |
|
14 |
SPUR CORPORATION |
ZA |
Hotels & restaurants |
1.57 |
70.41 |
18.47 |
26.85 |
136 |
|
14 |
REUNERT |
ZA |
Machinery, equipment, furniture, |
2.23 |
66.09 |
20.56 |
23.15 |
136 |
|
16 |
EGYPTIAN INTERNATIONAL PHARMACEUTICALS |
EG |
Chemicals, rubber, plastics, non-metallic products |
1.46 |
78.22 |
12.94 |
29.64 |
137 |
|
17 |
TANZANIA CIGARETTE COMPANY |
TZ |
Wholesale & |
1.14 |
72.16 |
27.74 |
34.06 |
138 |
|
18 |
FAMOUS BRANDS |
ZA |
Hotels & restaurants |
1.25 |
76.51 |
25.15 |
20.69 |
142 |
|
19 |
AFRICAN RAINBOW MINERALS |
ZA |
Metals & metal products |
1.62 |
77.35 |
9.02 |
37.75 |
145 |
|
20 |
LAFARGE ZAMBIA |
ZM |
Chemicals, rubber, plastics, non-metallic products |
1.28 |
58.99 |
21.46 |
46.99 |
155 |
|
21 |
EGYPTIAN CHEMICAL INDUSTRIES |
EG |
Chemicals, rubber, plastics, non-metallic products |
30.37 |
97.26 |
4.43 |
32.64 |
160 |
|
22 |
LEWIS GROUP |
ZA |
Wholesale & |
4.12 |
69.28 |
9.99 |
20.49 |
164 |
|
22 |
MR PRICE GROUP |
ZA |
Wholesale & |
1.81 |
63.82 |
29.15 |
17.92 |
164 |
|
24 |
CANAL SHIPPING AGENCIES |
EG |
Transport |
2.24 |
70.05 |
6.88 |
54.24 |
165 |
|
25 |
ITALTILE |
ZA |
Wholesale & |
0.95 |
82.20 |
18.76 |
25.39 |
175 |
| Source For Data: Orbis By Bureau van Dijk
|
||||||||
Ranking second is Cie Minière de Touissit—the second-largest mining company in Morocco, which focuses on silver, lead and zinc mining. The company scored well overall in our rankings, and in the top 10 for both liquidity and profit margin.
Coming in third is retailer Truworths International of South Africa, listed on the Johannesburg Stock Exchange, which boasts 650 fashion outlets in South Africa and 40 more across the continent. Truworths came in third for liquidity and sixth for ROA.
The Tanzanian arm of global cargo handling firm Swissport—listed on the Dar es Salaam Stock Exchange—ranks fourth in the list, with a particularly strong showing in return on assets (in which the firm ranked first).
By sector, Sidi Kerir Petrochemicals of Egypt leads the chemicals and related industries, with a strong ranking in both ROA and profit margin. Coming first in the construction segment is residential builder Calgro M3. In addition to performing well in our ranking, the black-empowered property developer focuses on the creation of sustainable communities.
Next Page: Best Performing Companies By Sector
Back To Supplment
BEST-PERFORMING COMPANIES BY SECTOR
Rank |
Company |
Country |
Liquidity Ratio |
Leverage Ratio |
Return On Assets |
Profit Margin (%) |
Total Score |
|
|---|---|---|---|---|---|---|---|---|
Chemicals, Rubber,Plastics, Non-Metallic products |
||||||||
|
1 |
SIDI KERIR PETROCHEMICALS |
EG |
1.75 |
68.29 |
25.31 |
47.77 |
102 |
|
|
2 |
ABU KIR FERTILIZERS AND CHEMICAL INDUSTRIES |
EG |
2.06 |
65.46 |
27.79 |
41.38 |
102 |
|
|
3 |
SOCIETE LES CIMENTS DU MAROC |
MA |
1.81 |
84.24 |
10.71 |
29.67 |
125 |
|
|
4 |
MISR CEMENT COMPANY – QENA |
EG |
1.50 |
63.94 |
27.58 |
39.09 |
132 |
|
|
5 |
EGYPTIAN INTERNATIONAL PHARMACEUTICALS |
EG |
1.46 |
78.22 |
12.94 |
29.64 |
137 |
|
Construction |
||||||||
|
1 |
CALGRO M3 |
ZA |
0.76 |
43.50 |
10.95 |
17.87 |
387 |
|
|
2 |
TALAAT MOUSTAFA GROUP |
EG |
1.36 |
47.62 |
1.19 |
21.66 |
393 |
|
|
3 |
PALM HILLS DEVELOPMENTS |
EG |
1.21 |
27.79 |
2.38 |
16.51 |
474 |
|
|
4 |
WILSON BAYLY HOLMES – OVCON |
ZA |
1.22 |
36.31 |
3.16 |
2.21 |
543 |
|
|
5 |
GROUP FIVE |
ZA |
1.14 |
27.11 |
4.04 |
4.36 |
546 |
|
Food, Beverages, Tobacco |
||||||||
|
1 |
PHOENIX BEVERAGES |
MU |
1.22 |
75.58 |
14.52 |
14.74 |
197 |
|
|
2 |
SOCIETE FRIGORIFIQUE ET BRASSERIE DE TUNIS |
TN |
1.25 |
63.96 |
13.15 |
18.46 |
216 |
|
|
3 |
NAMIBIA BREWERIES |
NA |
1.11 |
60.45 |
13.34 |
14.17 |
262 |
|
|
4 |
FAN MILK |
GH |
1.17 |
65.39 |
12.15 |
12.19 |
263 |
|
|
5 |
DELTA SUGAR |
EG |
0.72 |
75.11 |
12.43 |
19.06 |
279 |
|
Gas, Water, Electricity |
||||||||
|
1 |
AIR LIQUIDE DE TUNISIE |
TN |
1.56 |
57.01 |
9.75 |
14.96 |
263 |
|
|
2 |
LYONNAISE DES EAUX DE CASABLANCA |
MA |
n.a. |
100.00 |
1.59 |
90.41 |
385 |
|
|
3 |
KENYA ELECTRICITY GENERATING |
KE |
1.07 |
30.66 |
1.13 |
23.00 |
480 |
|
|
4 |
UMEME |
UG |
0.96 |
25.89 |
5.82 |
10.28 |
506 |
|
|
5 |
KENYA POWER & LIGHTING |
KE |
0.73 |
24.63 |
2.93 |
9.12 |
599 |
|
Hotels & Restaurants |
||||||||
|
1 |
SPUR CORPORATION |
ZA |
1.57 |
70.41 |
18.47 |
26.85 |
136 |
|
|
2 |
FAMOUS BRANDS |
ZA |
1.25 |
76.51 |
25.15 |
20.69 |
142 |
|
|
3 |
TRANSCORP HOTELS |
NG |
1.45 |
74.33 |
4.63 |
30.06 |
237 |
|
|
4 |
CITY LODGE HOTELS |
ZA |
1.53 |
33.21 |
16.28 |
35.62 |
255 |
|
|
5 |
GOLDEN PYRAMIDS PLAZA |
EG |
1.34 |
53.99 |
6.94 |
41.85 |
262 |
|
Metals & Metal Products |
||||||||
|
1 |
COMPAGNIE MINIERE DE TOUISSIT |
MA |
4.27 |
81.11 |
20.24 |
49.35 |
46 |
|
|
2 |
ASSORE |
ZA |
2.37 |
92.06 |
21.13 |
25.26 |
73 |
|
|
3 |
SOCIETE METALLURGIQUE D’IMITER |
MA |
5.74 |
87.99 |
13.59 |
31.20 |
74 |
|
|
4 |
AFRICAN RAINBOW MINERALS |
ZA |
1.62 |
77.35 |
9.02 |
37.75 |
145 |
|
|
5 |
KUMBA IRON ORE |
ZA |
0.63 |
53.05 |
21.07 |
39.37 |
303 |
|
Post & Telecommunications |
||||||||
|
1 |
EGYPTIAN SATELLITE |
EG |
5.76 |
77.98 |
14.89 |
38.32 |
72 |
|
|
2 |
TELECOM EGYPT |
EG |
1.98 |
84.65 |
6.28 |
25.03 |
181 |
|
|
3 |
SOCIETE NATIONALE DE TELECOMMUNICATIONS DU SENEGAL |
SN |
0.99 |
58.59 |
17.17 |
38.37 |
220 |
|
|
4 |
MTN GROUP |
ZA |
1.23 |
52.60 |
12.65 |
33.92 |
237 |
|
|
5 |
VODACOM GROUP |
ZA |
0.91 |
30.35 |
17.77 |
23.07 |
349 |
|
Primary Sector |
||||||||
|
1 |
ALEXANDRIA MINERAL OILS |
EG |
4.63 |
85.86 |
21.95 |
10.92 |
123 |
|
|
2 |
AFROCENTRIC INVESTMENT |
ZA |
2.54 |
71.99 |
9.85 |
12.58 |
198 |
|
|
3 |
OCEANA GROUP |
ZA |
1.62 |
58.71 |
19.29 |
17.38 |
199 |
|
|
4 |
SEPLAT PETROLEUM DEVELOPMENT |
NG |
1.85 |
55.93 |
9.68 |
32.55 |
211 |
|
|
5 |
MASTER DRILLING GROUP |
ZA |
1.22 |
67.79 |
9.91 |
19.74 |
228 |
|
Transport |
||||||||
|
1 |
ALEXANDRIA CONTAINER AND CARGO |
EG |
6.00 |
89.86 |
37.33 |
59.31 |
13 |
|
|
2 |
SWISSPORT TANZANIA |
TZ |
2.67 |
71.87 |
46.54 |
42.06 |
67 |
|
|
3 |
CANAL SHIPPING AGENCIES |
EG |
2.24 |
70.05 |
6.88 |
54.24 |
165 |
|
|
4 |
GRINDROD |
ZA |
2.70 |
53.29 |
3.23 |
8.99 |
390 |
|
|
5 |
TRENCOR |
ZA |
1.23 |
31.93 |
1.78 |
25.68 |
428 |
|
Wholesale & Retail Trade |
||||||||
|
1 |
TRUWORTHS INTERNATIONAL |
ZA |
4.35 |
82.24 |
29.79 |
31.39 |
51 |
|
|
2 |
TANZANIA CIGARETTE |
TZ |
1.14 |
72.16 |
27.74 |
34.06 |
138 |
|
|
3 |
LEWIS GROUP |
ZA |
4.12 |
69.28 |
9.99 |
20.49 |
164 |
|
|
4 |
MR PRICE GROUP |
ZA |
1.81 |
63.82 |
29.15 |
17.92 |
164 |
|
|
5 |
ITALTILE |
ZA |
0.95 |
82.20 |
18.76 |
25.39 |
175 |
|
| Source For Data: Orbis By Bureau van Dijk
|
||||||||

Phoenix Beverages of Mauritius tops the ranking for food, beverages and Tobacco, and Tunisia’s Air Liquide Tunisie comes first in the gas, water and electricity segment. In the hotels and restaurants sector, it is steakhouse franchise Spur Corporation of South Africa that leads the pack. The company boasts a big international presence—particularly in the UK. Egyptian Satellite and Telecom Egypt rank first and second, respectively, for post and telecommunications companies, and Alexandria Mineral Oils, also of Egypt, tops the ranking for the primary sector.
PERFORMANCE RISKS
African public companies are dealing with a number of risks that could have a significant impact on their performance over the rest of the year. In particular, they will be facing volatility related to a continued commodity price decline, uncertainty over the timing and impact of a US Federal Reserve rate hike, and the slowdown in China.
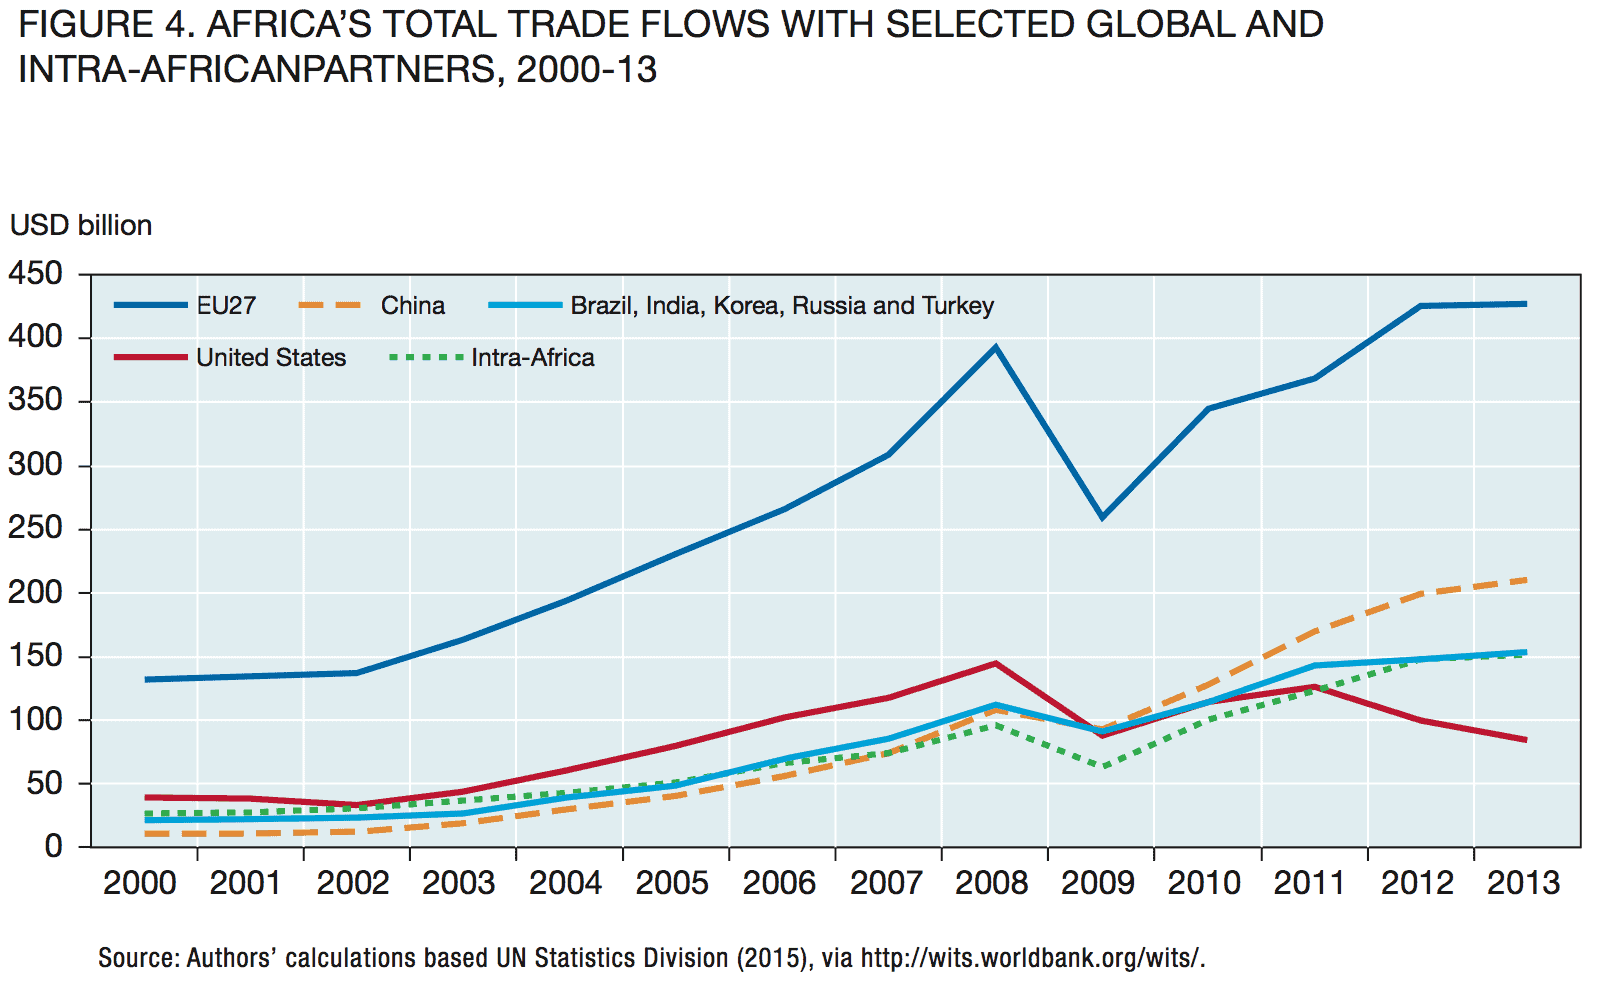
Some African countries are very exposed to China, particularly Angola. The Southern African nation relies heavily on Chinese state-owned enterprises for infrastructure developments, and China is its biggest export partner—taking more than 60% of Angolan exports (especially oil and iron), according to MIT’s Observatory of Economic Complexity.
Most African frontier markets are actually oil importers. In fact, the vast majority of countries on the continent benefit, overall, from lower oil prices. The notable exceptions are Angola, Nigeria and the handful of other major oil producers.
Currency volatility is a critical issue for companies in Africa. Currency weakness has dogged a number of markets and continues to be of concern.
Philippe de Pontet, director, Africa, at Eurasia Group, notes that “The cedi of Ghana has lost over 50% of its value over the last calendar year. Likewise, the Zambian kwacha is under extreme stress—mostly because of global economic conditions but, more specifically, the fall in copper prices.”
De Pontet added: “Clearly for local companies—and multinational companies on the ground—it is a tremendous headache dealing with uncertainty over the exchange rate.” He notes that quite a few African countries are still pegged to the euro, so they are exposed to its fluctuations. But the euro and dollar fluctuate much less than indigenous African currencies. “Those monetary systems that are pegged either to the dollar or euro might be better positioned than some others.”
Rising inflation is also a concern for corporates, with Nigeria, for example, likely to breach double-digit inflation by the end of the year.
The risk surrounding a US interest rate hike is the same as that faced by companies—and countries—worldwide: uncertainty as to timing and increased borrowing costs. De Pontet notes: “It is likely we will see, at least in the immediate aftermath [of a rate hike], a spike in yields in frontier markets, almost irrespective of the country.”