The key question that many companies struggle with is: How much of the exposure should be hedged? Answering this question in the absence of a scientific metric leaves room for subjectivity and inconsistency.

Global Finance recently announced the Corporate FX Awards 2021. As close observers of corporate finance, we could not help but notice that a common theme among the winning corporations was their ability to (i) quantify FX risk, (ii) efficiently net-off cross-currency and cross-asset exposures by leveraging their non-zero correlations and (iii) effectively deploy derivatives to manage the residual risks.
Two of the award winners specifically, Ford and Nike, employed techniques that helped them manage multi-currency exposures while keeping hedging costs reasonable: Value-at-Risk (VaR) and its close cousin Cash Flow-at-Risk (CFaR). VaR is a globally recognized framework in banks and financial institutions. The methodology became an asset management industry standard after J.P. Morgan published the RiskMetrics framework in 1992, but its application in corporate finance has been limited to large companies.
The application of this tool by large treasury departments such as Ford’s and Nike’s has proven to have contributed towards scientific and objective FX risk management. We see potential for this measure to be used more widely, especially given that simple statistical tools are available to help treasury managers estimate the measure and use it on the go. In this article, we expand on the conceptual backdrop of VaR and explore the merits of its use by multinational corporate treasuries, drawing from our recent paper on the same subject.
A large number of multinational companies face FX exposures in more than one currency, thereby creating a portfolio of multi-currency cash flows. Managing such a portfolio is similar to managing a slew of risky investments. A typical portfolio manager aims to maximize expected returns while minimizing their volatility—the classic Sharpe ratio criterion. Likewise, in the context of FX portfolios, a corporate entity tries to minimize unexpected movement in its future cash flows with the help of hedge instruments such as FX forwards, options, and swaps.
The key question that many companies struggle with is: How much of the exposure should be hedged? Answering this question in the absence of a scientific metric leaves room for subjectivity and inconsistency. Moreover, Treasury Managers and senior management may have different perspectives and their own subjective views on the FX market that may influence decision to hedge. Lack of a common frame of reference may result in unfair expectation of a corporate treasury or worse, an inefficient risk management as the treasurer and senior management goals may not be aligned. Hence the need for a quantitative metric that condenses all FX exposures into a single number and can be used to determine hedge ratios in a consistent, unbiased manner.
Value-at-Risk is a measure of the maximum loss that can occur over a period of time, with a certain level of confidence. When we say that a one-year VaR on the FX portfolio of a company is $100 with a 95% level of confidence, in simple terms it means that the company is likely to see an FX loss of less than $100 in 95% of the cases, but in 5% of the cases it could be more than that. VaR is based on the volatility of each individual currency pair in the portfolio, the direction of exposure (inflow or outflow), and the correlation among those currencies. It nets out the exposures that are in opposite direction, and considers whether the currencies tend to move together or against each other to determine the final, residual number that represents a risk to the company. The risk on this number is assessed against the historical volatility in portfolio currencies and, at a certain statistical level of confidence, a maximum loss is estimated which can be expected to occur over a given time period.
The measure can be applied to any company in the world. Let us walk through the simple example1 of United Phosphorous Limited (UPL)—for illustration only, based on the company’s publicly available data but no knowledge of its hedging strategies or risk management. UPL is an India headquartered firm that sells agricultural inputs. Of their total revenue of $5 billion in 2020, Latin America (chiefly Mexico and Argentina) contributed about 40%, followed by North America and Europe each at 15%, and India at 10%. The company also imports components that are invoiced in USD, and that exceed its revenue from the United States. Lastly, the firm has capital account exposures in the form of borrowings in USD and JPY, totaling about $3 billion.
Since the reporting currency of UPL is the Indian Rupee (INR), it faces FX risk on multiple fronts: USD-INR, MXN-INR, ARS-INR, EUR-INR, and JPY-INR. If the USD appreciates against INR, the firm ends up paying more for its imports than it benefits on its exports. Likewise, if JPY appreciates against INR, the firm’s cost of borrowing goes up because it has to repay a larger amount when the borrowing becomes due. On the other hand, if MXN, ARS, or EUR depreciate against INR, the firm realizes a smaller revenue.
Absent a common risk metric, the firm would not know how much of each currency’s exposure it needs to hedge. Even if it determined that X% of exposures need to be hedged, it would not be able to account for the fact that these currency pairs may have a non-zero correlation between them that could potentially offer diversification benefits. It might even be the case that the best decision is not to hedge anything at all (if the currencies were perfectly negatively correlated)! It is important to determine the optimal hedge ratio because FX derivatives come at a cost and carry additional burden of accounting requirements.
Here is where VaR comes in handy. Firstly, based off the fact that there is a USD inflow and a larger USD outflow in the form of imports and long-term debt, the company can net-off the two streams to hedge only the residual USD outflows. Secondly, instead of fully hedging every currency pair separately, a VaR model can identify the negative correlation between USD-INR, and Latin American currencies such as ARS-INR. The correlation is negative because, say if USD appreciates, INR would depreciate against it, making imports costlier for UPL. However, it is known that when USD appreciates, ARS tends to depreciate by a much larger magnitude, which means that INR appreciates relative to ARS and makes exports more rewarding to UPL. The aggregated effect is therefore a function of how much costlier the imports get versus how much richer the exports get. Without understanding these underlying correlations, a company would simply hedge away both exposures separately and end up paying a higher cost. Thus, UPL would then need to hedge only the larger of the two exposures, to the extent that diversification benefit is not available.
Concretely, a VaR measure would tell the company how much it can expect to lose in the event of FX movement if it were to hedge some, all, or none of its exposure. In the paper we create a scenario analysis table to compare the various levels of hedge ratio and the associated VaR—a helpful way to determine the optimal hedge ratio and the cost of achieving the same.
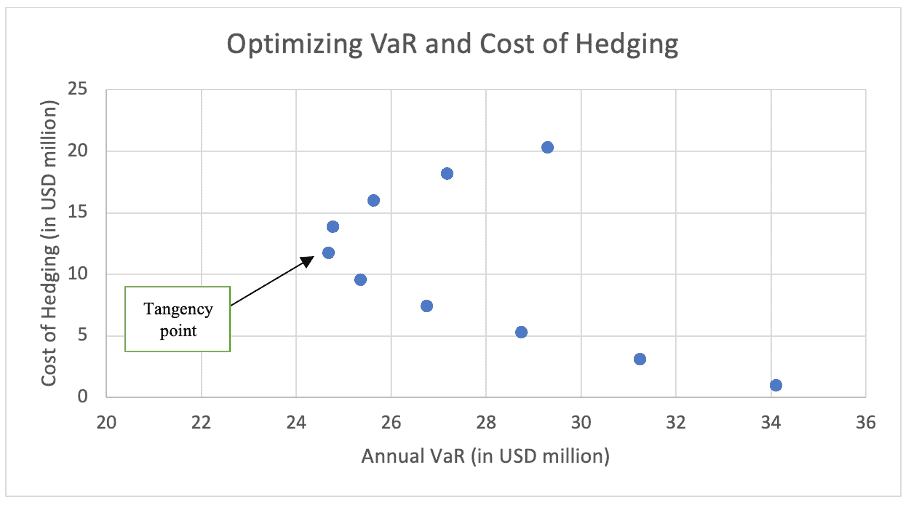
It is also important to understand that the only way to bring VaR down to absolute zero is to hedge 100% of all FX exposures. This is both overly conservative and pretty costly. Hence, it is a smarter approach to draw up an efficient frontier of VaR against associated hedge cost (think again of Sharpe ratio) to locate that level of hedge ratio where the best combination of VaR-cost trade-off is achieved. Below is how a hypothetical efficient frontier could look, comparing the level of VaR against the respective cost of hedging. The tangency point is where the combination of VaR and cost is more efficient for the company to pursue.
Being a quantitative tool that relies on historical data, VaR comes with its own limitations. As the COVID-19 crisis showed us yet again, asset correlations are ever changing and volatility is far from static. VaR relies on estimates of both, and these need to be regularly updated to keep the model as close to current reality as possible. Even then, “fat-tail” events that occur once in a decade cannot be fully factored into such models. Therefore, while VaR provides a strong framework for hedging currency risks in general, it cannot supplement active monitoring of market risk by corporate treasuries that need to act swiftly when crises strike without announcement.
The full paper is available at: https://papers.ssrn.com/sol3/papers.cfm?abstract_id=3767162
1This example is for illustration purpose only. It is based on publicly available data from the company’s filings and does not comment on the company’s actual foreign exchange hedging policy or efficacy of the company’s risk management program.
About the Authors