Thomas Ramge and Jon Schwochow make understanding business and economics easy through the visualization of data.
You might think that a picture book would be beneath the sophistication of today’s modern professionals, especially finance professionals. But if it’s a book about data, pictures hold the ticket to making common and complex subjects readily accessible.
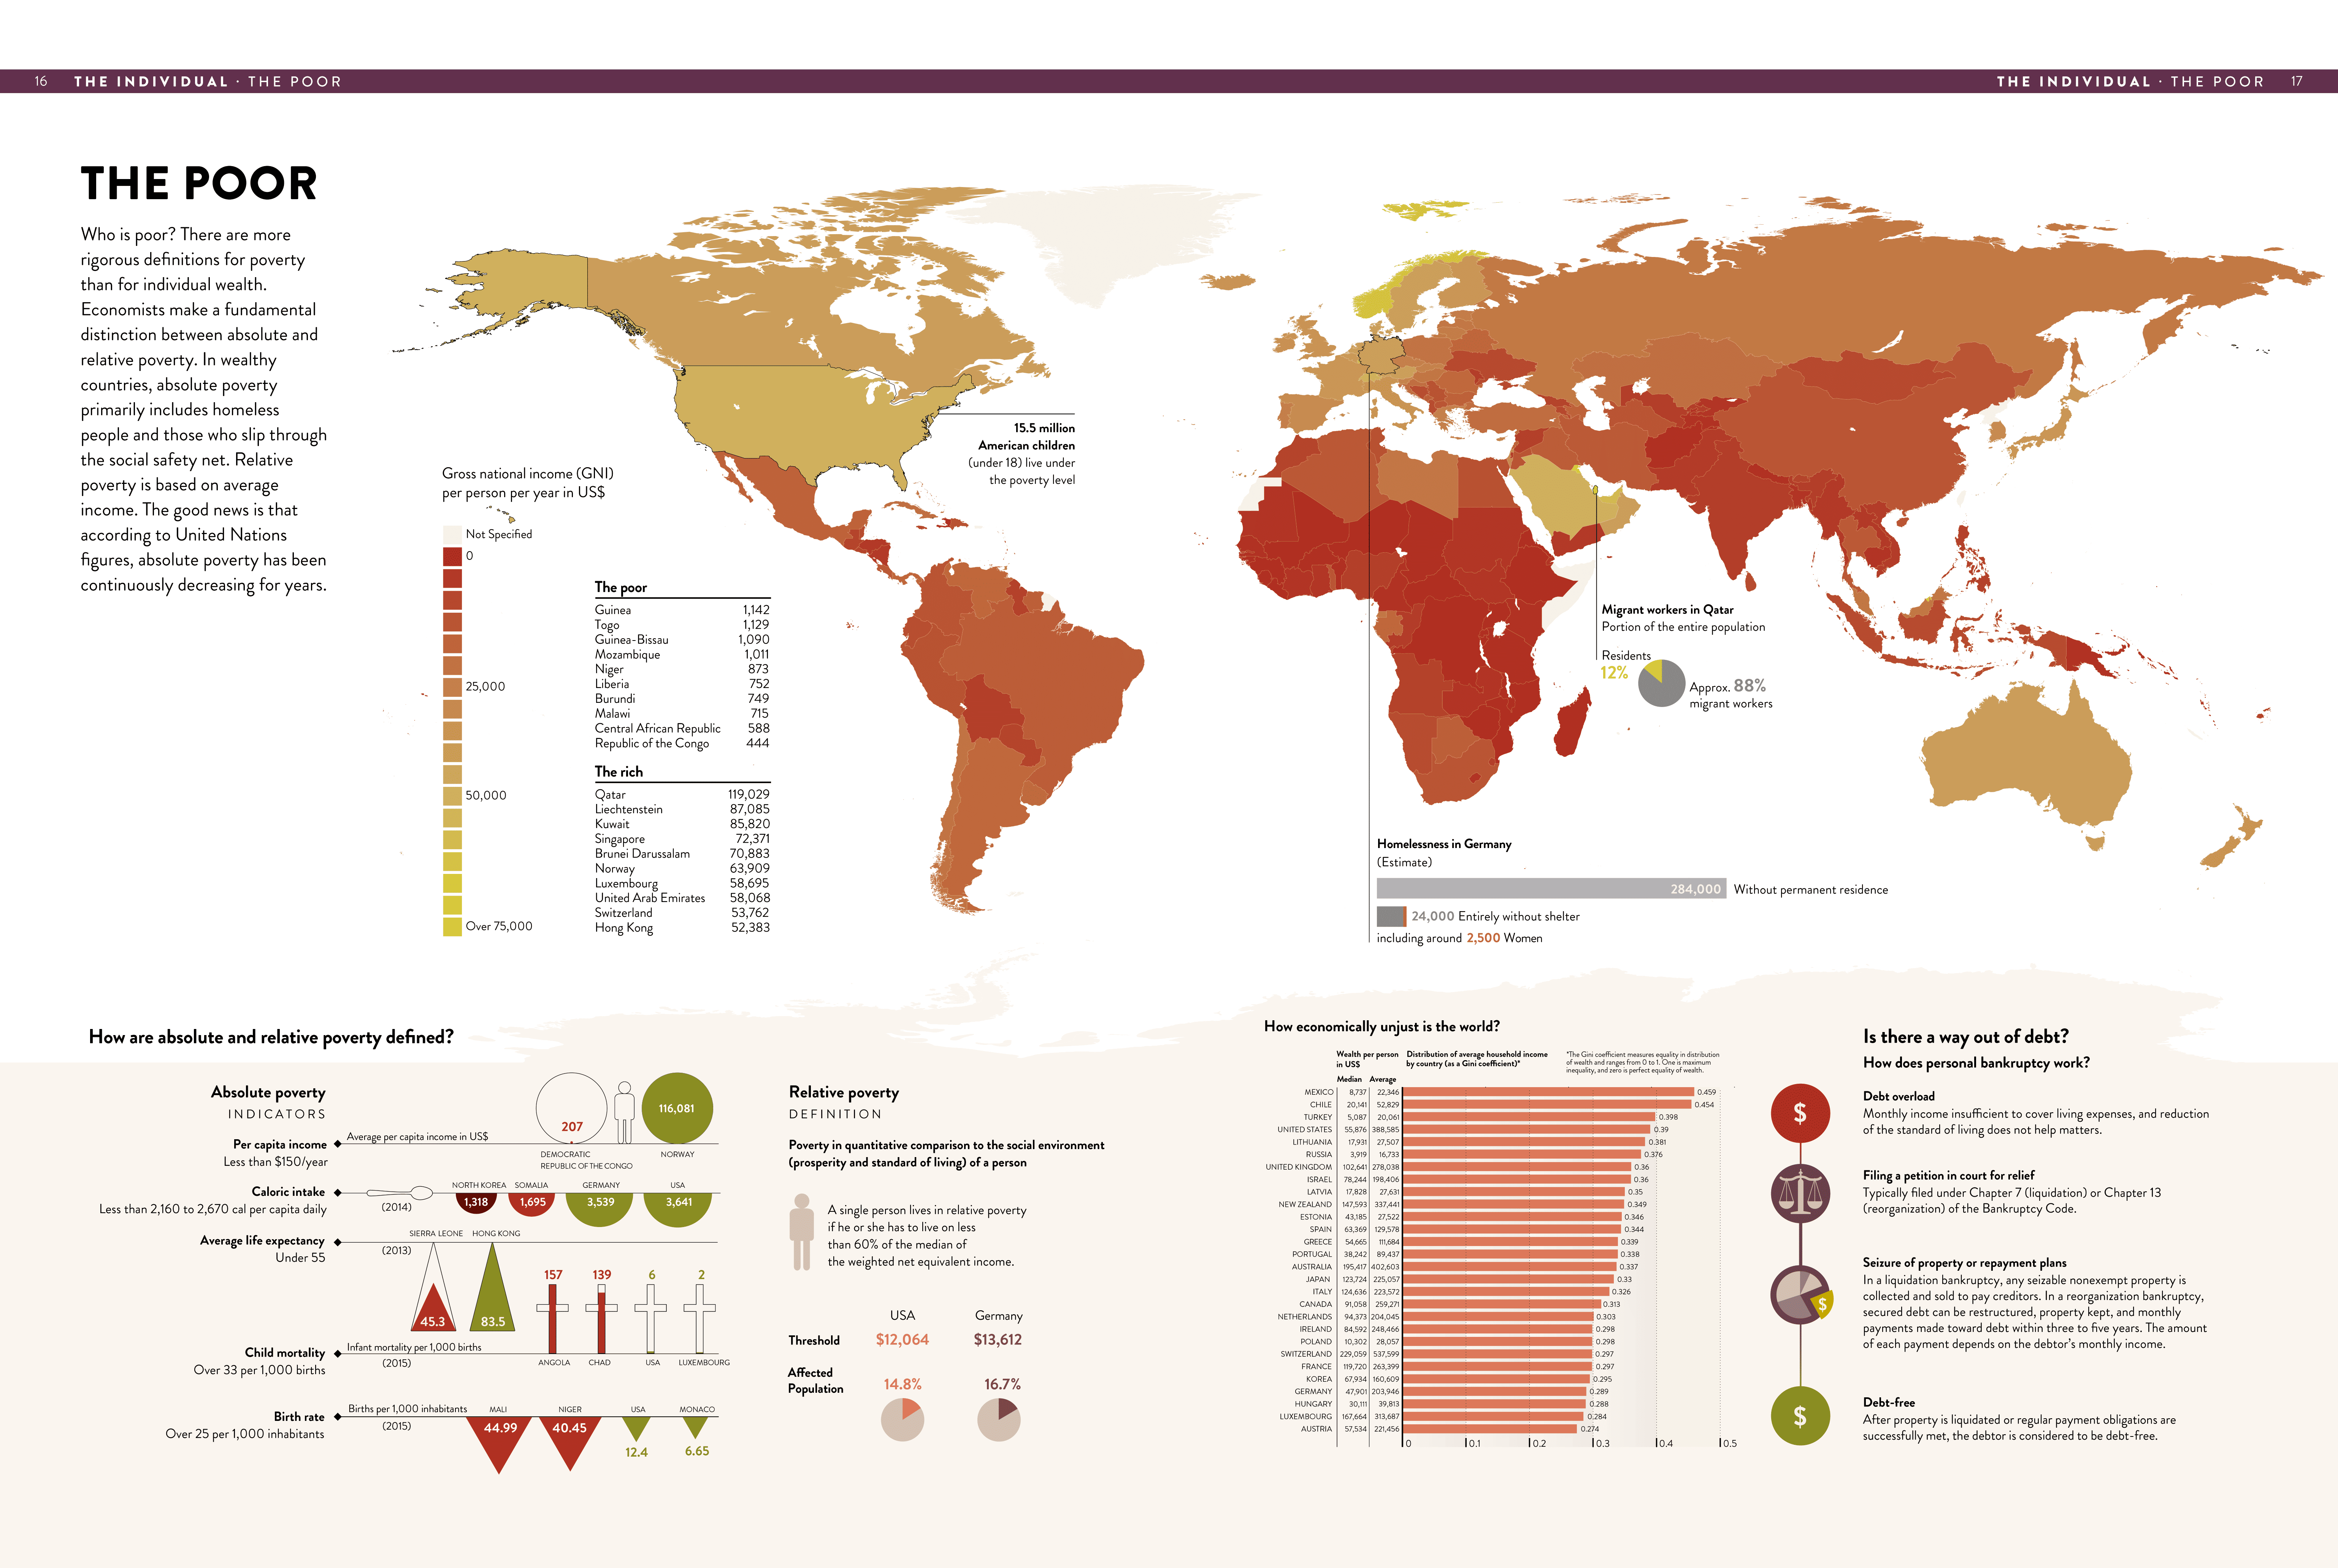
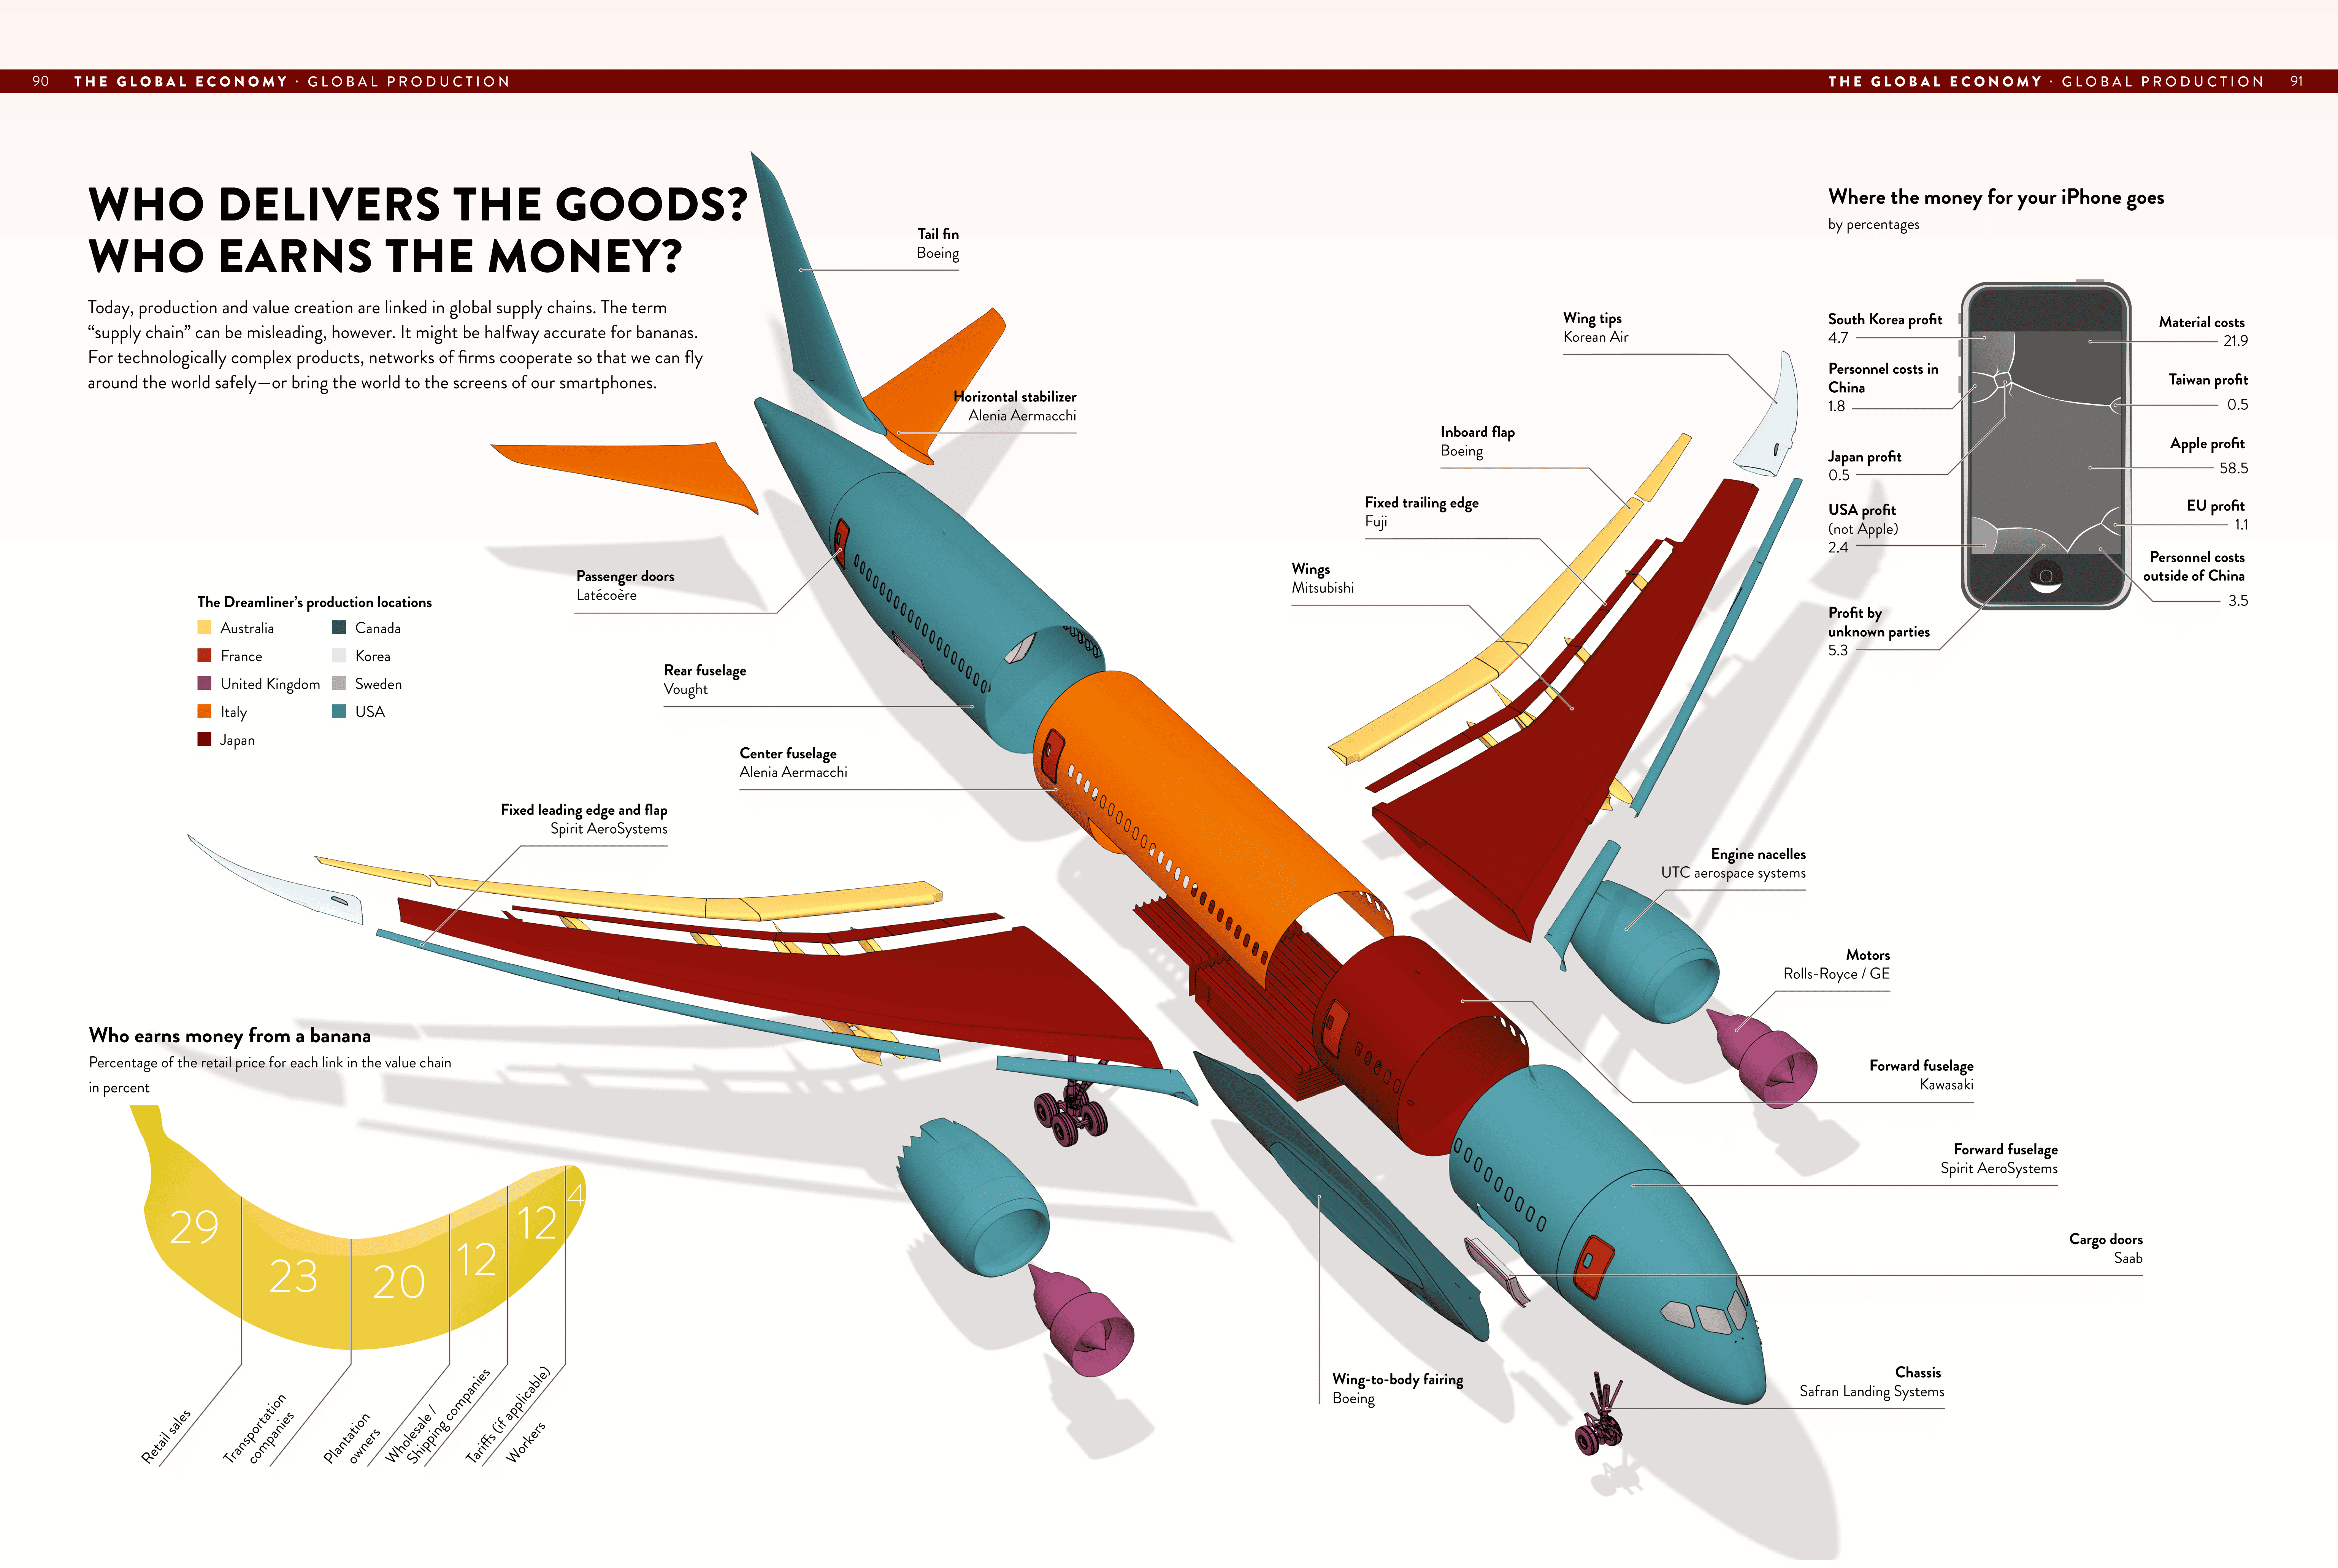
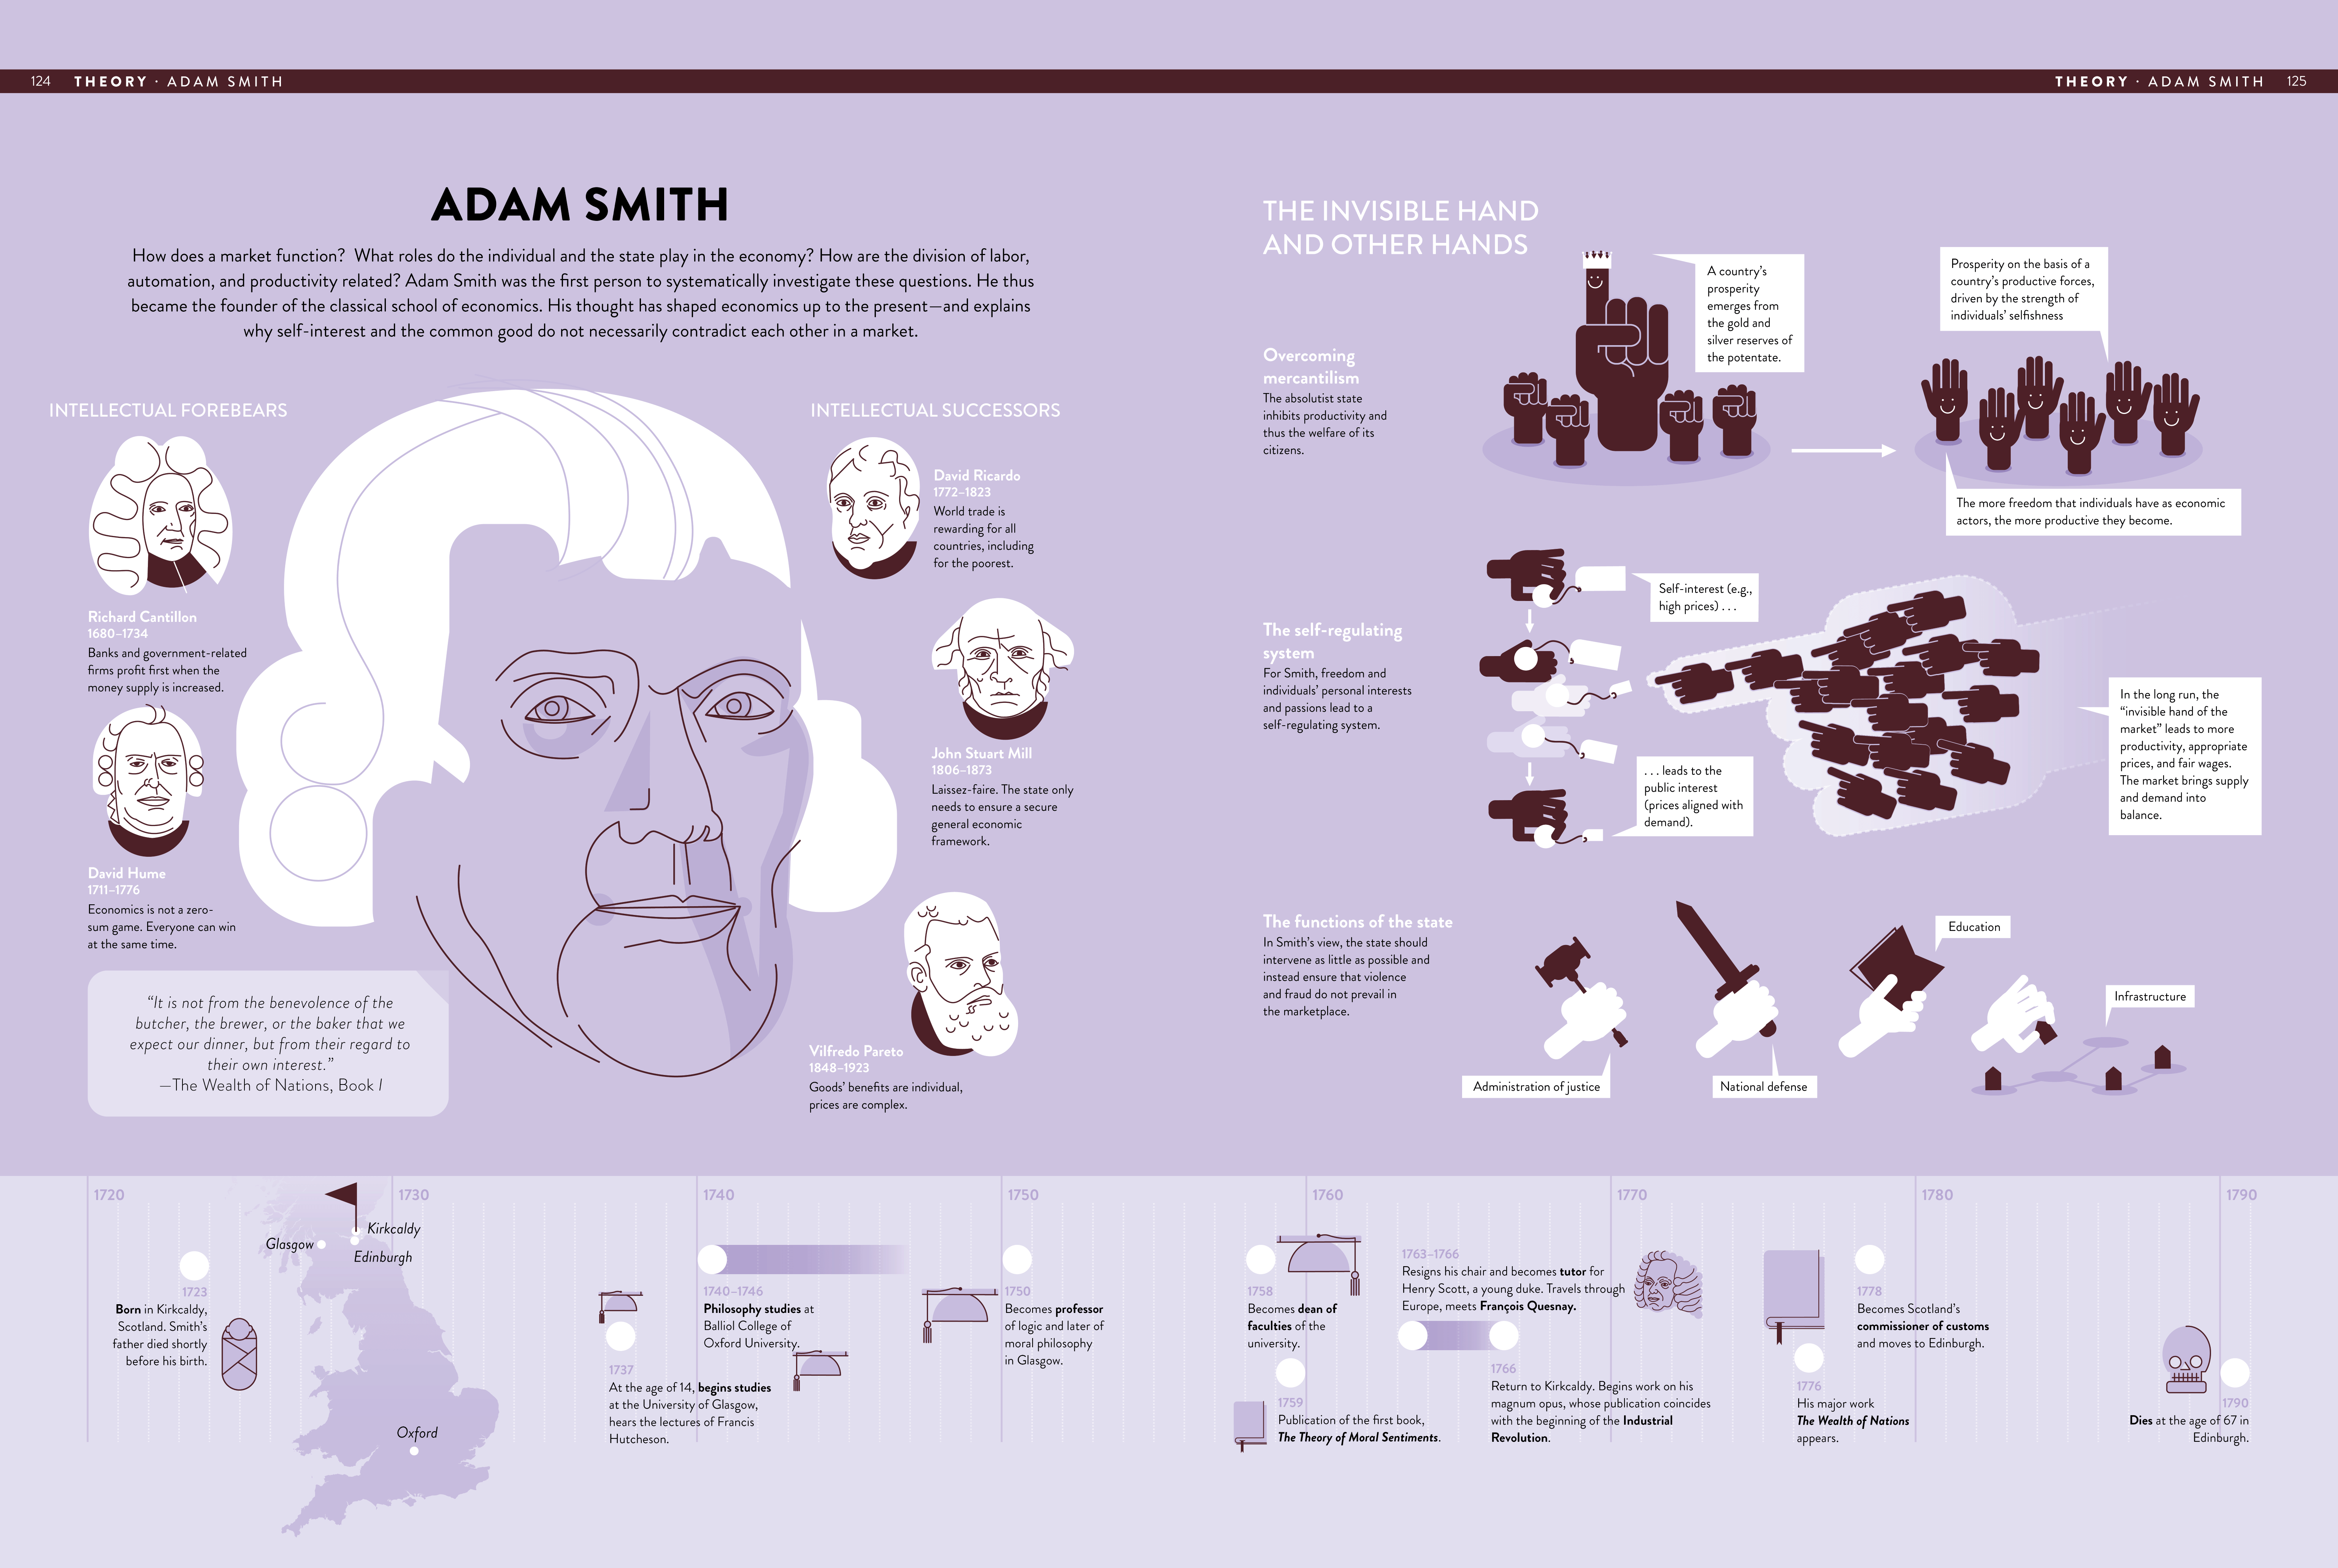
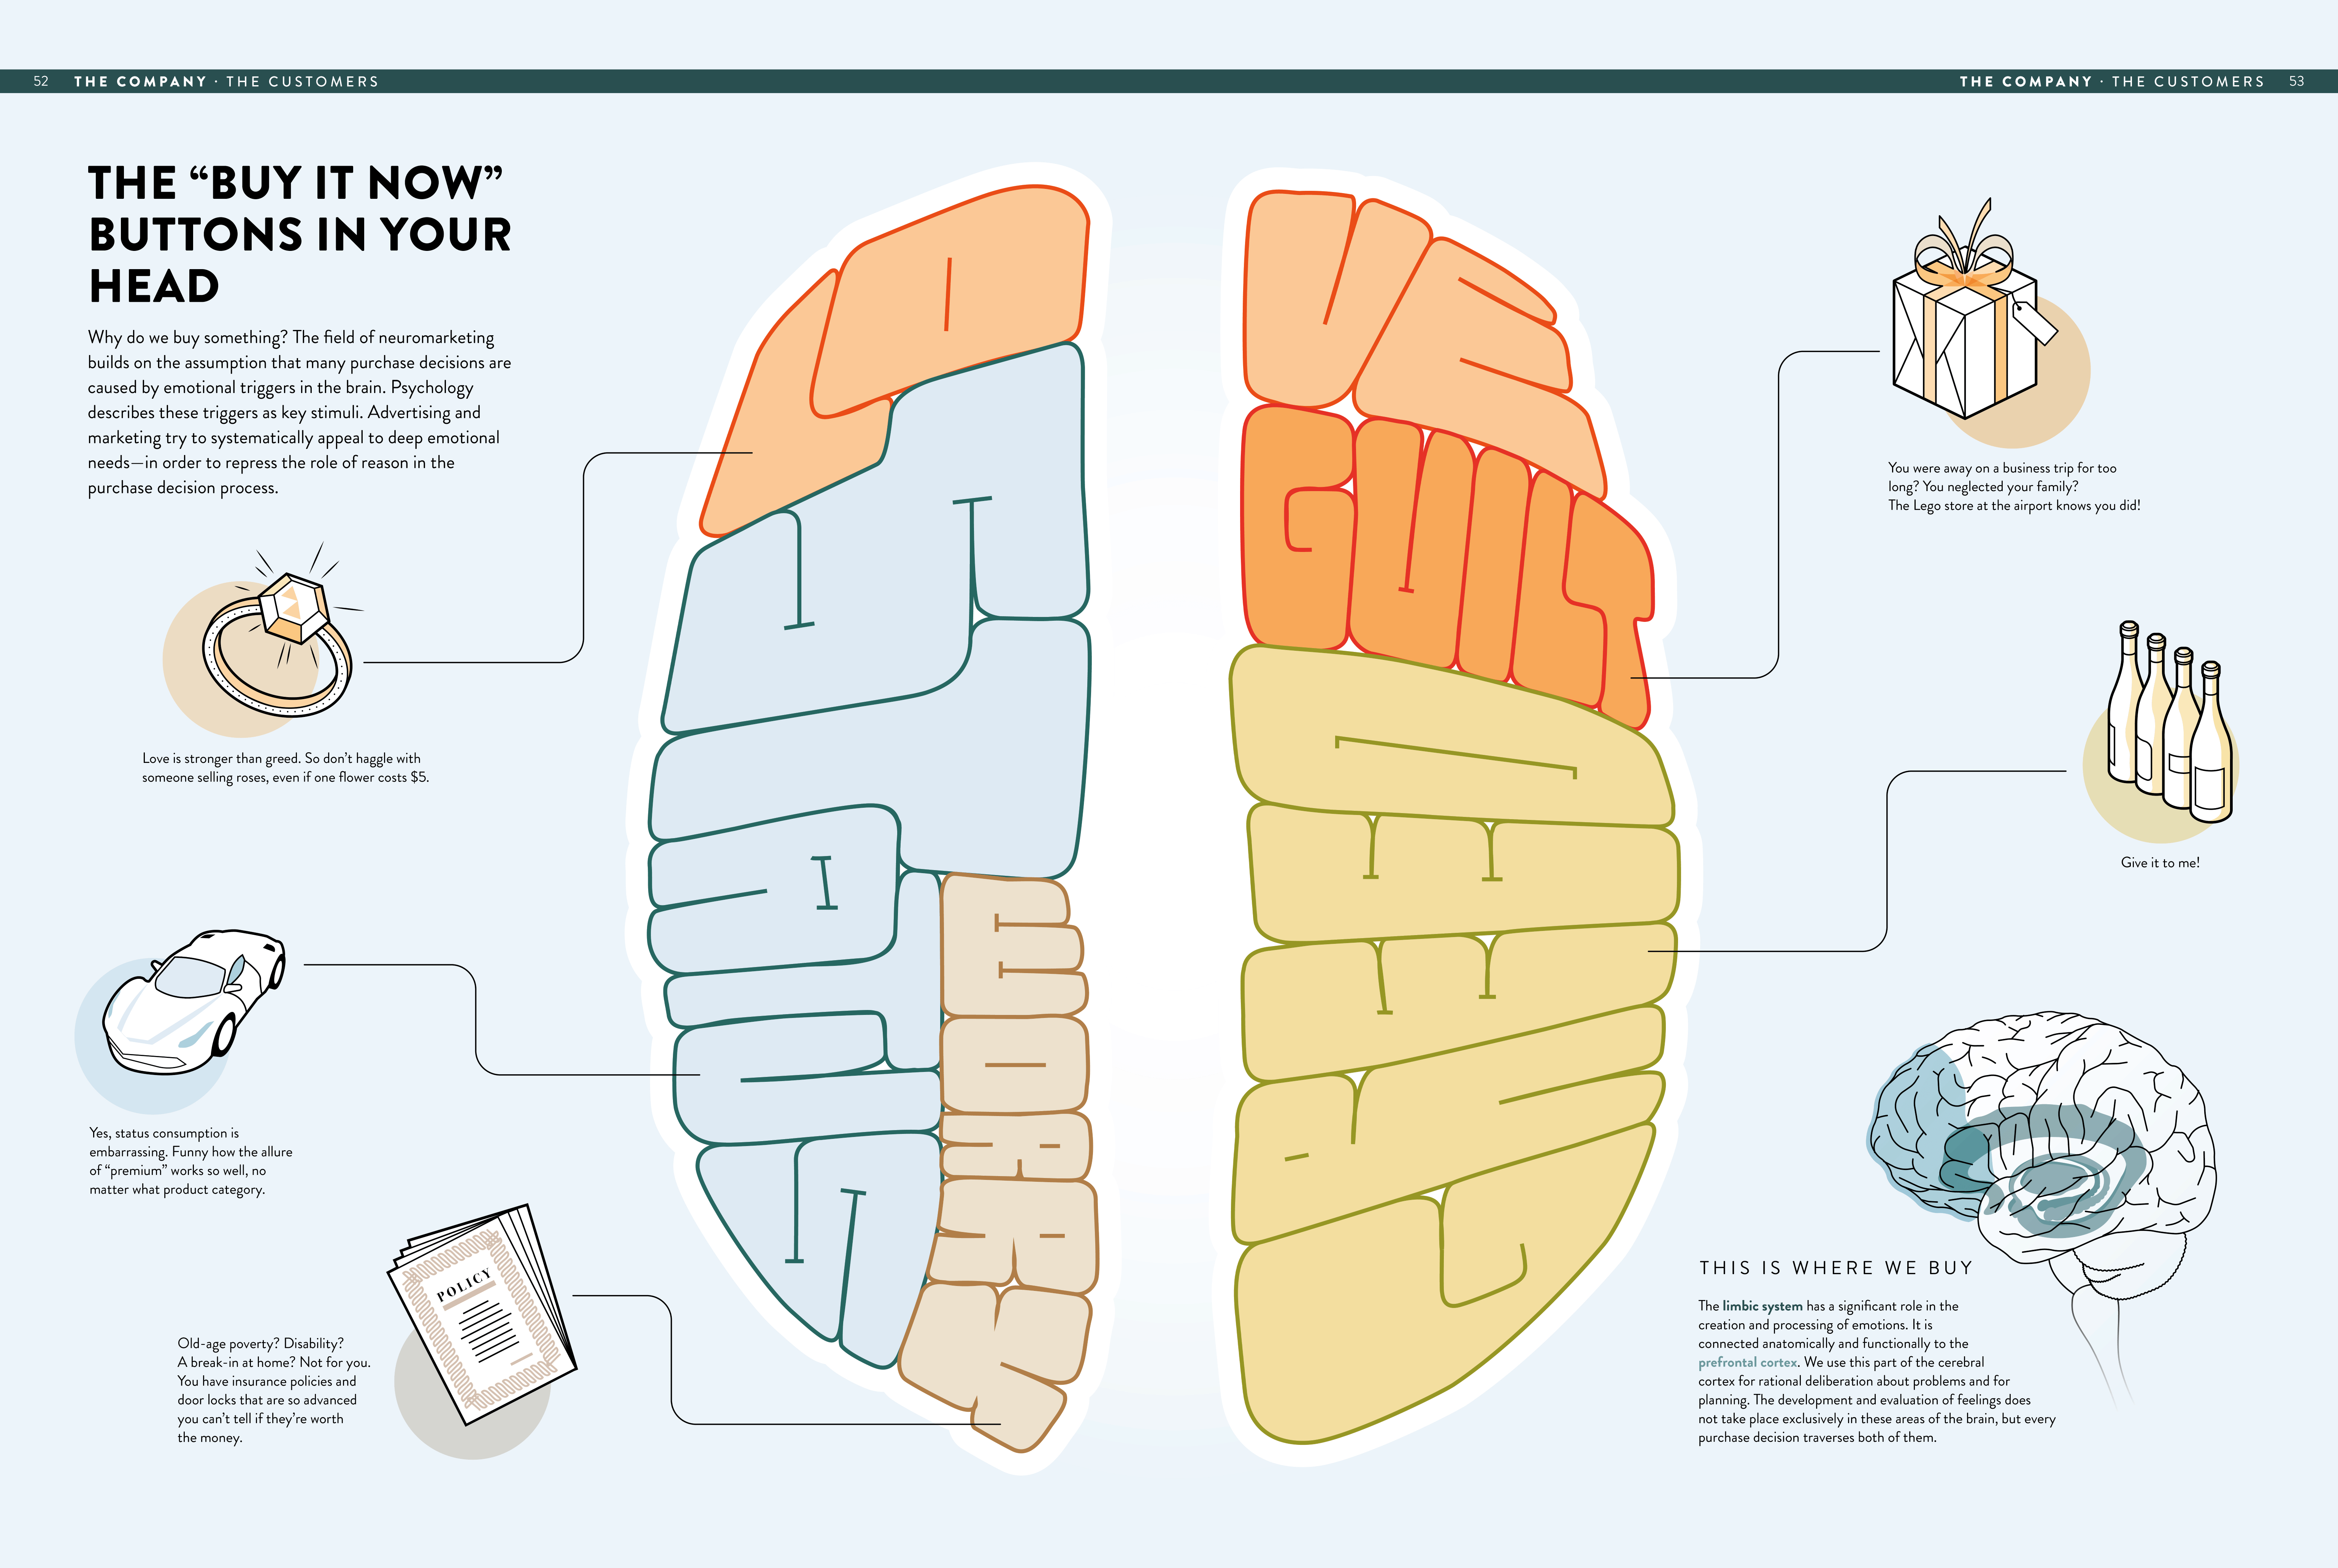
Even financial sophisticates have a new appreciation for the power of visuals, which make it easier for readers to absorb and digest the information. This insight inspired Thomas Ramge and Jan Schwochow to create The Global Economy as You’ve Never Seen It: 99 Ingenious Infographics That Help You Put It All Together. “This is not only information, but a book on how the economy works” said Ramge.
Ramge, a business journalist, and Schwochow, an infographic specialist, partnered up to tell the story of how the economy works through visual data. “The key to what we have done?” Ramge pointed out, is “simplification, aggregation and condensation of data, with an eye on a easy-to-read presentation.”
The first edition was published in Germany as Wirtschaft Verstehen by Ullstein Buchverlage in 2016. An English edition, published by The Experiment, was released this year. The success of the first edition, which sold around 30,000 copies in Germany, allowed Ramge and Schwochow to expand their audience and share their information with other countries. The book sales shows that books still hold appeal in the digital age, and that there’s a thirst for such high-quality content.
Ramge and Schwochow also said that even people whose jobs involve economic issues, or who work in finance, found they got good value from the book’s visual explanations. Journalists and advocates who talk all the time about GDP, for example, find upon consideration they really don’t know what goes into that figure. The original book took seven or eight years to create; from researching to deciding how to explain the information, sketching and creating the individual graph, to formatting the text, each graph is a laborious process. Schwochow has a team of graphic artists with specialized talents, such as 3-D design, who worked on this project.
Translating the book was no simple task. Euro-centric information did not belong in the Americanized edition, so adjustments were made. The English edition is fully updated from 2016 with new information on rapidly changing topics, such as Bitcoin. It also features a brand-new spread on multinationals and brand names that only appears in this edition of the book.
Ramge and Schwochow created this book as an introduction to the world of economics. Schwochow and Ramge said that the target audience of this book is “people who want to understand more about the economy.” The infographics present what seems like a complicated topic and display it in a way that is easy to understand and fun to memorize. For example, one infographic shows how a car is made, another breaks down the formula for GDP. These are subjects people discuss every day but are not completely informed about.
While ideas of a creating a digital platform to display the information are floating around, there are some reservations. When curating the electronic book, it was difficult to find a format that could be useable across all platforms. For example, a reader viewing graphs on a Kindle Paperwhite would not be seeing all of the information a reader on a standard desktop computer. There is also an issue as to whether or not to include a paywall or to leave the data available for free. When asked about the work process, Ramge said “it was worth all the work—nearly two years of work and seven years of manpower—but an update would be difficult. And it is built in a way that does not feel outdated, as most data reflect long term developments.” For now, a physical copy of the book provides readers with a snapshot as to how the economy works.
Ramge and Schwochow hope that with the straight facts presented in this book, people will broaden their horizons and learn something new. “If you read the book, there are all the important issues of the economy, including economic theory”, said Ramge. This new knowledge will hopefully lead to more meaningful debates and discussions. The infographics included in The Global Economy as You’ve Never Seen It: 99 Ingenious Infographics That Help You Put It All Together are, in fact, ingenious. They will not go out of date in the next few years, show a sense of how visions are born, and are “full of global content that anyone can learn from and enjoy”, according to Ramge.