2015 Rankings are based on the GDP (PPP) of a country, which compares the generalized differences in the cost of living and standards between countries.
INTRODUCTION
A small size, a large endowment of natural resources and/or a highly developed banking system appear to be key ingredients for countries that hope to achieve high standards of living, not necessarily an easy model to replicate. In fact, according to the International Monetary Fund, the ranking of nations by per-capita income is dominated by those that possess such characteristics, starting with Qatar, which, in 2015, has an estimated per-capita GDP (PPP) more than 50% higher than second placed Luxembourg. The United States, which comes in at number nine is the only truly large and diverse economy on the list.
Overall, there are two standard methods of defining the richest countries in the world. One takes into account the economies that are the largest, as measured by total gross domestic product (GDP). However, the most commonly accepted definition of the wealthiest countries is to determine how rich the average resident of a country is. For this reason, the best method is to use GDP data per capita.
Moreover, using a PPP (purchasing power parity) basis is arguably more useful when comparing generalized differences in living standards on the whole between nations. This is because PPP takes into account the relative cost of living and the inflation rates of the countries, rather than using just exchange rates, which may distort the real differences in income. This is the measure most economists prefer when looking at per-capita wealth and when comparing economic strength between countries and living conditions or use of resources across countries.
Values are expressed in current international dollars, reflecting a single year’s (the current year) currency exchange rates and PPP adjustments.
THE 10 RICHEST COUNTRIESIN THE WORLD
#10 | SWITZERLAND
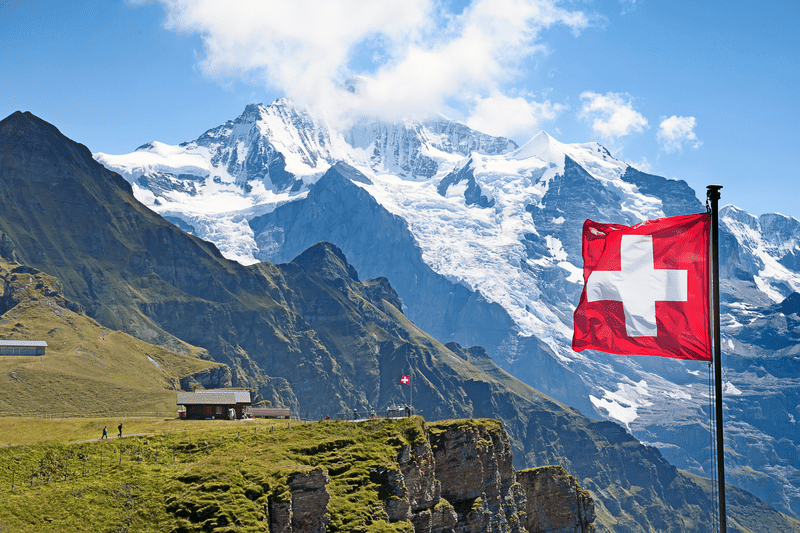
Current International Dollars: 56,815.63
Robust public finances, a vibrant financial services sector, its location at the heart of the European Union yet its independence in economic and monetary affairs have ensured high standards of living in this country, where per capita GDP (PPP) in 2015 was estimated at nearly US$57,000 despite an economic readjustment due to the Swiss Central Bank’s decision to let the Swiss Franc appreciate against the Euro.
VIEW FULL LIST OF COUNTRY RANKINGS
#9 | UNITED STATES

Current International Dollars: 57,045.46
With an estimated $57,000 in 2015, the United States is the largest and most diverse economy to make the top ten of countries with the world’s highest income per capita (PPP). This is a testament to how, through a mix of government spending, increased regulations and growing competitiveness, the US has managed to bounce back from the depth of the recession triggered by the collapse of Wall Street in 2008.
VIEW FULL LIST OF COUNTRY RANKINGS
#8 | HONG KONG

Current International Dollars: 57,676.79
Hong Kong enjoys the unique status of being the gateway to China’s huge economy while also having a robust framework of rules and regulations and a first class financial services industry. Per capita GDP (PPP) in 2015 is estimated at nearly US$58,000.
VIEW FULL LIST OF COUNTRY RANKINGS
#7 | UNITED ARAB EMIRATES
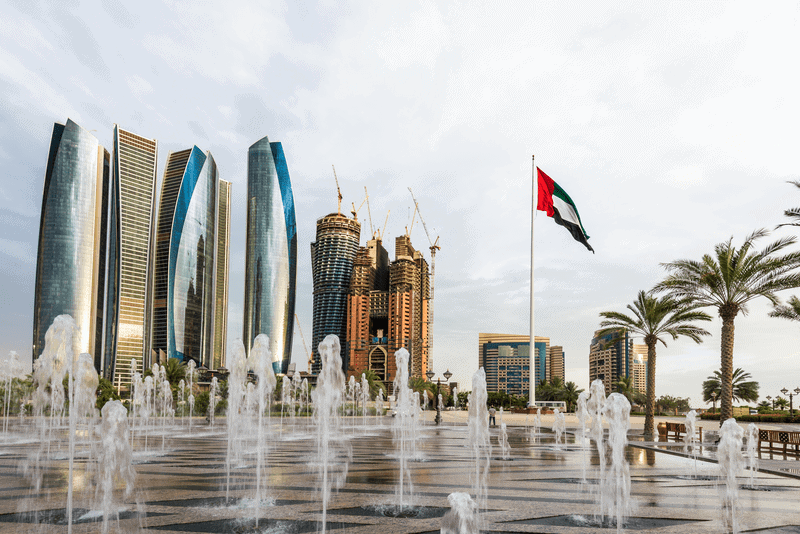
Current International Dollars: 67,201.88
The UAE is ahead of other countries similarly reliant on hydrocarbon exports in its attempt to diversify the country’s economic base. The government has expended great effort in improving the UAE’s ability to attract Foreign Direct Investment, particularly in highly innovative, technology-intensive sectors. Per capita GDP (PPP) in 2015 remains among the world’s ten highest at an estimated US$67,000.
VIEW FULL LIST OF COUNTRY RANKINGS
#6 | NORWAY
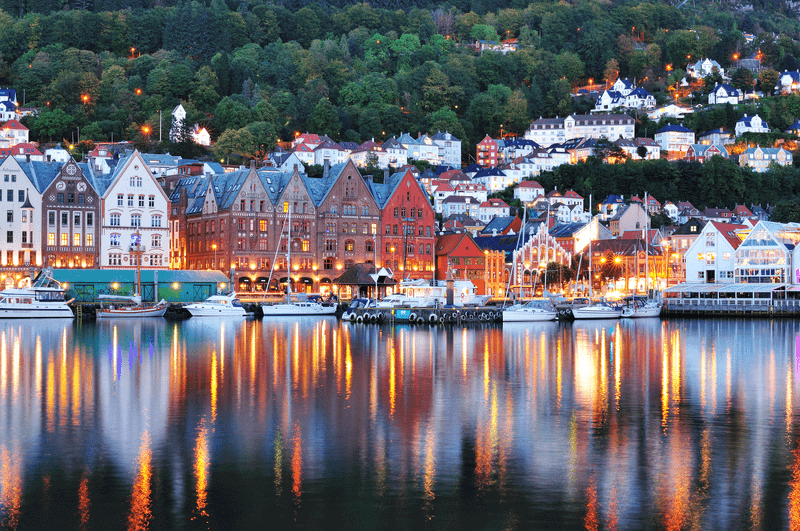
Current International Dollars: 67,619.10
The oil sector has pushed Norway’s standards of living higher and higher in the last two decades. In 2015, the country’s per capita GDP (PPP) is estimated at nearly US$68,000. The recent fall of oil prices, however, presents a challenge to the Norwegian economy. Norwegian authorities have plenty of tools to cope with it, including an independent monetary policy and a sound institutional and macroeconomic framework, but there is no doubt that Norway is now facing a more uncertain environment than it has in a long time.
VIEW FULL LIST OF COUNTRY RANKINGS
#5 | KUWAIT

Current International Dollars: 71,600.96
Lower oil prices are a threat to this economy so heavily reliant on hydrocarbon exports. Nevertheless, the government’s five-year development plan, capital spending push and fiscal reforms are ensuring continued economic growth in the non-oil sectors and, for the time being, keeping up the country’s very high per capita income (PPP), of nearly US$72,600 in 2015.
VIEW FULL LIST OF COUNTRY RANKINGS
#4 | BRUNEI

Current International Dollars: 80,335.27
Its rich endowment of oil and gas resources has afforded this small Sultanate one of the world’s highest incomes per capita (PPP), estimated by the IMF at more than US$80,000 in 2015. With the recent decline in energy prices, Brunei’s economic foundations have been somewhat shaken. Therefore the government is pushing to diversify the economy and hopes to launch a new stock exchange by 2017 in order to strengthen the country’s capital markets.
VIEW FULL LIST OF COUNTRY RANKINGS
#3 | SINGAPORE

Current International Dollars: 84,821.40
The city-state’s solid fundamentals and large current account surplus are sustaining the economy and fostering moderate growth even at a time when the fragility of the global economy and high household debt present a risk to this very open, trade-oriented economy. Incomes (PPP) remain the third highest in the world, estimated at nearly US$85,000 in 2015.
VIEW FULL LIST OF COUNTRY RANKINGS
#2 | LUXEMBOURG

Current International Dollars: 94,167.01
Largely thanks to a strong and vibrant financial services sector, Luxembourg can count on a wealthy and stable economy, low public debt, and robust institutions, affording it the second highest per capita GDP (PPP) in the world, estimated at more than US$94,000 in 2015. Tightening banking regulations across Europe and the world represent the one source of uncertainty going forward.
VIEW FULL LIST OF COUNTRY RANKINGS
#1 | QATAR
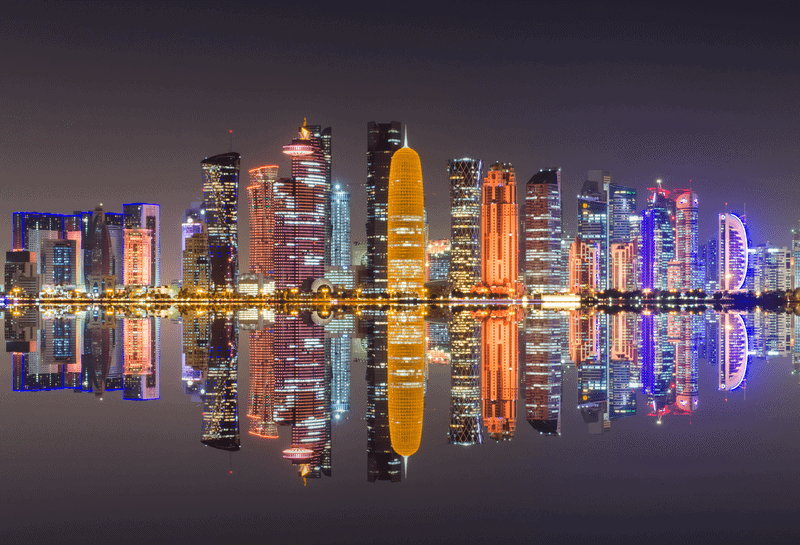
Current International Dollars: 146,011.85
With the infrastructure push for the 2022 FIFA Soccer World Cup further lifting its already rapidly-growing economy, and its reliance on gas exports shielding it, at least to some extent, from lower oil prices, Qatar continues to dominate the list of countries with the highest incomes per capita (PPP) in the world, with more than US$146,000 in 2015.
VIEW FULL LIST OF COUNTRY RANKINGS
Gross domestic product (GDP) based on purchasing-power-parity (PPP) per capita.
Values are expressed in current international dollars, reflecting a single year’s (the current year) currency exchange rates and PPP adjustments.
Ranking | Country | 2015 International |
|---|---|---|
1 | Qatar | 146,011.85 |
2 | Luxembourg | 94,167.01 |
3 | Singapore | 84,821.40 |
4 | Brunei Darussalam | 80,335.27 |
5 | Kuwait | 71,600.96 |
6 | Norway | 67,619.10 |
7 | United Arab Emirates | 67,201.88 |
8 | Hong Kong | 57,676.79 |
9 | United States | 57,045.46 |
10 | Switzerland | 56,815.63 |
11 | Saudi Arabia | 56,253.43 |
12 | Bahrain | 52,830.01 |
13 | Netherlands | 48,797.89 |
14 | Ireland | 48,786.91 |
15 | Australia | 48,288.43 |
16 | Austria | 46,906.12 |
17 | Sweden | 46,386.42 |
18 | Germany | 46,165.86 |
19 | Taiwan | 45,996.57 |
20 | Canada | 45,981.99 |
21 | Denmark | 45,800.36 |
22 | Oman | 44,903.66 |
23 | Iceland | 44,575.14 |
24 | Belgium | 42,923.15 |
25 | France | 41,396.01 |
26 | Finland | 41,393.81 |
27 | United Kingdom | 39,224.92 |
28 | Japan | 38,797.39 |
29 | Korea, Republic Of | 37,413.01 |
30 | New Zealand | 36,342.72 |
31 | Italy | 35,228.02 |
32 | Spain | 34,228.87 |
33 | Israel | 34,162.24 |
34 | Malta | 32,977.12 |
35 | Trinidad And Tobago | 32,346.41 |
36 | Slovenia | 30,266.44 |
37 | Equatorial Guinea | 29,735.42 |
38 | Czech Republic | 29,658.73 |
39 | Slovak Republic | 28,887.72 |
40 | Cyprus | 28,329.38 |
41 | Lithuania | 28,245.32 |
42 | Estonia | 27,729.44 |
43 | Portugal | 27,180.22 |
44 | Greece | 27,008.05 |
45 | Malaysia | 25,833.20 |
46 | Bahamas | 25,793.62 |
47 | Poland | 25,703.48 |
48 | Seychelles | 25,624.02 |
49 | Hungary | 25,406.32 |
50 | Kazakhstan | 25,367.27 |
51 | Russian Federation | 25,350.86 |
52 | Latvia | 25,195.47 |
53 | Chile | 24,170.03 |
54 | Antigua And Barbuda | 23,071.33 |
55 | Gabon | 22,878.98 |
56 | Argentina | 21,924.29 |
57 | Panama | 21,634.56 |
58 | Uruguay | 21,387.31 |
59 | Saint Kitts And Nevis | 21,073.34 |
60 | Croatia | 20,873.01 |
61 | Romania | 20,355.72 |
62 | Turkey | 20,299.39 |
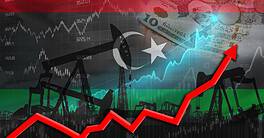
63 | Libyan Arab Jamahiriya | 19,182.46 |
64 | Azerbaijan | 18,913.51 |
65 | Belarus | 18,882.48 |
66 | Mauritius | 18,836.44 |
67 | Mexico | 18,714.05 |
68 | Lebanon | 18,358.02 |
69 | Bulgaria | 17,869.22 |
70 | Venezuela, Bolivarian Republic Of | 17,787.39 |
71 | Suriname | 17,502.96 |
72 | Iran, Islamic Republic Of | 16,918.28 |
73 | Botswana | 16,758.31 |
74 | Barbados | 16,500.31 |
75 | Montenegro | 15,996.01 |
76 | Palau | 15,839.60 |
77 | Turkmenistan | 15,837.26 |
78 | Costa Rica | 15,534.03 |
79 | Brazil | 15,518.77 |
80 | Thailand | 15,319.51 |
81 | Algeria | 14,802.35 |
82 | Colombia | 14,164.43 |
83 | China | 13,992.69 |
84 | Macedonia, FYR | 13,901.13 |
85 | Iraq | 13,817.09 |
86 | Dominican Republic | 13,347.97 |
87 | South Africa | 13,078.00 |
88 | Maldives | 12,987.71 |
89 | Serbia | 12,971.49 |
90 | Peru | 12,638.84 |
91 | Jordan | 12,397.90 |
92 | Grenada | 12,091.83 |
93 | Tunisia | 11,896.99 |
94 | Ecuador | 11,839.19 |
95 | Albania | 11,688.93 |
96 | Egypt, Arab Republic | 11,443.89 |
97 | Saint Lucia | 11,432.50 |
98 | Saint Vincent And The Grenadines | 11,380.20 |
99 | Namibia | 11,361.12 |
100 | Sri Lanka | 11,155.84 |
101 | Mongolia | 11,051.67 |
102 | Dominica | 11,029.40 |
103 | Indonesia | 10,759.18 |
104 | Bosnia And Herzegovina | 10,359.60 |
105 | Jamaica | 8,941.65 |
106 | Paraguay | 8,776.30 |
107 | Angola | 8,573.33 |
108 | Fiji | 8,553.95 |
109 | Ukraine | 8,493.56 |
110 | Belize | 8,338.99 |
111 | El Salvador | 8,275.84 |
112 | Bhutan | 8,252.83 |
113 | Georgia | 8,222.77 |
114 | Morocco | 8,097.23 |
115 | Swaziland | 8,053.70 |
116 | Armenia | 7,748.05 |
117 | Guatemala | 7,704.20 |
118 | Philippines | 7,412.24 |
119 | Timor Leste | 7,388.46 |
120 | Guyana | 7,279.77 |
121 | Congo, Rep. | 7,038.16 |
122 | Cape Verde | 6,569.82 |
123 | Bolivia | 6,530.17 |
124 | Nigeria | 6,467.23 |
125 | India | 6,176.29 |
126 | Viet Nam | 5,983.24 |
127 | Uzbekistan | 5,963.77 |
128 | Lao People’S Democratic Republic | 5,357.17 |
129 | Samoa | 5,355.84 |
130 | Tonga | 5,274.12 |
131 | Myanmar | 5,207.68 |
132 | Moldova | 5,091.05 |
133 | Nicaragua | 5,018.76 |
134 | Pakistan | 4,943.26 |
135 | Honduras | 4,849.30 |
136 | Sudan | 4,655.06 |
137 | Zambia | 4,345.33 |
138 | Ghana | 4,338.27 |
139 | Yemen | 3,992.87 |
140 | Bangladesh | 3,631.19 |
141 | Mauritania | 3,587.92 |
142 | Kyrgyz Republic | 3,581.33 |
143 | Cambodia | 3,533.63 |
144 | Sao Tome And Principe | 3,306.66 |
145 | Kenya | 3,304.48 |
146 | Marshall Islands | 3,292.47 |
147 | Micronesia, Federated States Of | 3,285.14 |
148 | Djibouti | 3,181.68 |
149 | Cameroon | 3,116.66 |
150 | Lesotho | 3,110.64 |
151 | Côte D’Ivoire | 3,096.65 |
152 | Papua New Guinea | 2,856.67 |
153 | Tajikistan | 2,830.14 |
154 | Chad | 2,805.09 |
155 | Vanuatu | 2,609.13 |
156 | Nepal | 2,516.94 |
157 | Senegal | 2,398.26 |
158 | South Sudan | 2,374.36 |
159 | Sierra Leone | 2,284.06 |
160 | Zimbabwe | 2,106.83 |
161 | Tanzania | 2,054.32 |
162 | Afghanistan | 2,051.05 |
163 | Benin | 1,957.78 |
164 | Solomon Islands | 1,877.21 |
165 | Gambia | 1,849.99 |
166 | Haiti | 1,846.12 |
167 | Uganda | 1,836.02 |
168 | Burkina Faso | 1,824.62 |
169 | Rwanda | 1,782.46 |
170 | Comoros | 1,735.13 |
171 | Ethiopia | 1,656.44 |
172 | Kiribati | 1,640.76 |
173 | Mali | 1,614.10 |
174 | Togo | 1,525.64 |
175 | Guinea-Bissau | 1,491.19 |
176 | Madagascar | 1,477.78 |
177 | Guinea | 1,388.74 |
178 | Eritrea | 1,210.15 |
179 | Mozambique | 1,208.61 |
180 | Niger | 1,069.59 |
181 | Burundi | 951.098 |
182 | Liberia | 934.095 |
183 | Malawi | 819.688 |
184 | Congo, Dem. Rep. | 753.907 |
185 | Central African Republic | 639.937 |
Where Are The Poorest Countries In The World?